When it comes to surface inspections, Eddy Current Array (ECA) has traditionally been associated with the use of handheld probes combined with manual data analysis. However, recent hardware developments have opened major opportunities for faster and increasingly more automated inspections over large surfaces. For example, the Eddyfi Spyne™ offers a coverage of 200 millimeters (8 inches) and scan speeds up to 600 millimeters (2 feet) per second.
At this scan speed, the Spyne can detect hundreds of surface flaw indications in a matter of minutes. This article shows that with the proper software tools, it is possible to measure, validate and report these indications automatically - without going through the headache of manual data analysis.
We offer some insights to improve the efficiency of ECA data analysis. Let’s consider the typical examination of a carbon steel pipeline with an outside diameter of 500 millimeters (20 inches) being inspected over a length of 6 meters (20 feet). The Spyne probe allows a raster scan of the entire pipe surface within a single datafile where hundreds of small Stress Corrosion Cracking (SCC) indications can be detected. A small portion of this surface is displayed in the C-scan below with the crack indications visible in orange on both sides of the longitudinal seam weld.

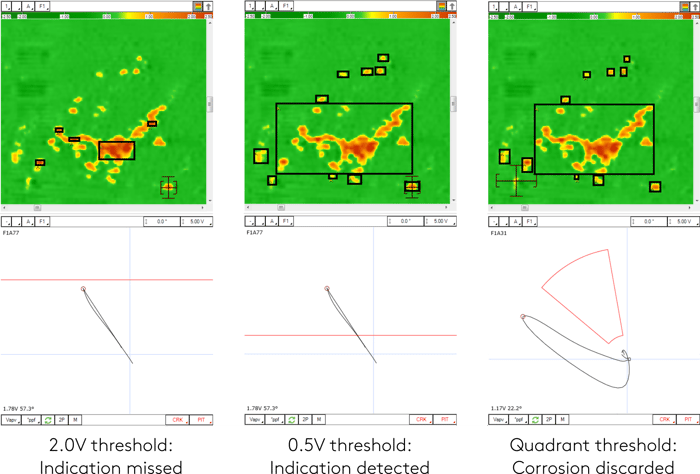
Magnifi® software removes the need to manually measure the eddy current signal of each indication; instead, a detection zone can be positioned directly in the impedance plane to automatically sort the crack indications and identify them in the C-scan. In the first (left) example below, the detection zone is a simple threshold represented by a red line in the impedance plane. The displayed signal that corresponds with what lies inside the C-scan cursor does not have a sufficient vertical amplitude to reach that threshold. As a result, it is not identified as a flaw in the C-scan. Only a few indications are strong enough to be automatically marked by the analysis software. In the second example, the same type of threshold is used at a lower impedance level. The result is obvious in the C-scan: all visible indications are now marked and identified as flaws. Finally, in the third example the threshold is replaced by a quadrant-shaped detection zone oriented at 60 degrees, the typical phase of crack indications in carbon steel for the Spyne. All the same indications remain identified with one exception at the bottom left corner of the C-scan; as shown by its signal phase around 20 degrees, this indication is that of sharp-edged corrosion. Using the quadrant detection zone instead of the threshold is thus advantageous here to discard non-crack indications.

With Magnifi’s Report Detections function, all marked indications displayed in the C-scan can be added to an inspection report with one click. The resulting surface screening report contains the position, size and type of flaw associated with every single indication.

Adjusting the detection zones can be done by scanning natural or fabricated (EDM) flaws of given target dimensions. This adjustment can be done either before an inspection or during the analysis without affecting the acquired data themselves. Interaction criteria can also be applied to the marked indications in the C-scan; instead of reporting multiple separate indications in close vicinity, they can be merged into a single larger colony indication. This is often more representative of manual reporting techniques such as Magnetic Particle Inspection (MPI). However, while similar in form, a well-built ECA report will always be more reliable and consistent, easier to interpret, and faster to produce than any MPI report.
To learn more about getting the most out of your Eddy Current Array (ECA) system, make sure to subscribe to our blog and newsletter. Our experts are always just an email away – get in touch today!


