
Service companies and asset owners both want to have inspections done as quickly as possible. Productivity depends just as much on the time spent on the inspection as the time required to perform the analysis. With PAUT and TFM systems getting quicker and quicker, data analysis can sometimes become the bottleneck for giving a decision about the integrity of a component.
With its latest release, Capture™ software provides new advanced analysis tools to help operators perform efficient and reliable evaluations. Accessible both on the M2M Gekko® and Mantis™ instruments or on a PC, these new tools allow inspectors to improve the productivity of their analysis and the quality of reporting.
The release of Capture 3.1 brings new tools for Total Focusing Method (TFM) technique. Plane Wave Imaging (PWI) appears to improve productivity and sensitivity and an Amplitude Fidelity algorithm, requested by Standards, has been implemented to provide an experimental verification of the pixel size.
Capture 3.1 also brings advanced analysis tools to improve the efficiency and productivity of assessment. Auto-sizing, C-scan stitching, 3D export and improved indicators are some of the tools now available for inspectors. In this blog, we offer an overview of these tools; subscribe now to receive notifications when we detail these features in future posts.
To assess an asset’s fitness-for-purpose, a fracture mechanics analysis is performed. This analysis requires input of the dimensions (length, height) of the defects found during the inspection. Ultrasonic techniques —conventional, PAUT or TFM— all provide signals that can be interpreted to size defects. Several characterization methods exist based on tip diffraction, amplitude drop, etc.
Capture 3.1 offers a new tool that allows automatic sizing of the defect based on a decibel drop method. The operator selects the decibel level (-6 dB or any other value) along the scan and index axis, circles the indication, and Capture then automatically measures the dimensions of the defect along both directions. Sizing is based on the maximum amplitude measured off the defect or from a reference amplitude. The indication is automatically added to the table of indications with all information (length, height, scan and index positions, etc.) necessary for assessment.
The following image shows the auto-sizing feature applied to the characterization of a lack of side wall fusion based on a reference level. 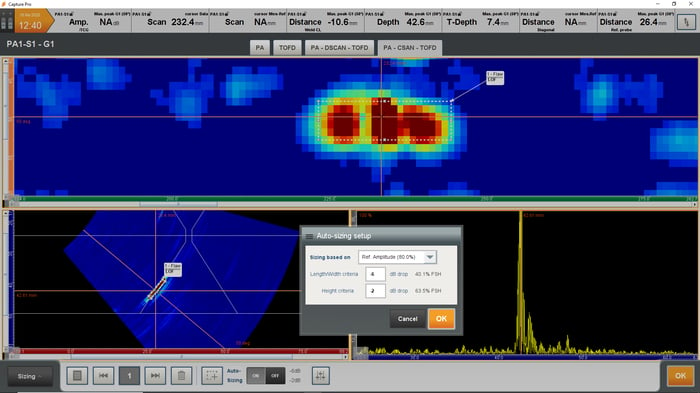
This feature allows quick sizing of indications detected during an inspection. Rather than manually measure all the features using several cursors, the auto-sizing feature automatically measures the length, height and position of the defects based on amplitude drop values defined by the inspectors.
Capture already displayed sectorial scans or TFM images in the 3D view of the component, but now it is possible to export the complete set of data in the 3D view as well. For multi-group configurations, Capture can export all PAUT groups in the same 3D view, allowing operators to quickly see the positions of the various indications while taking into account rebound off the various surfaces. Adjusting the gates and dynamic range allows limiting the visualization to the region of interest and see indications above a certain level.
The following images show a multi-group PAUT data export (left) and a corrosion mapping inspection (right). 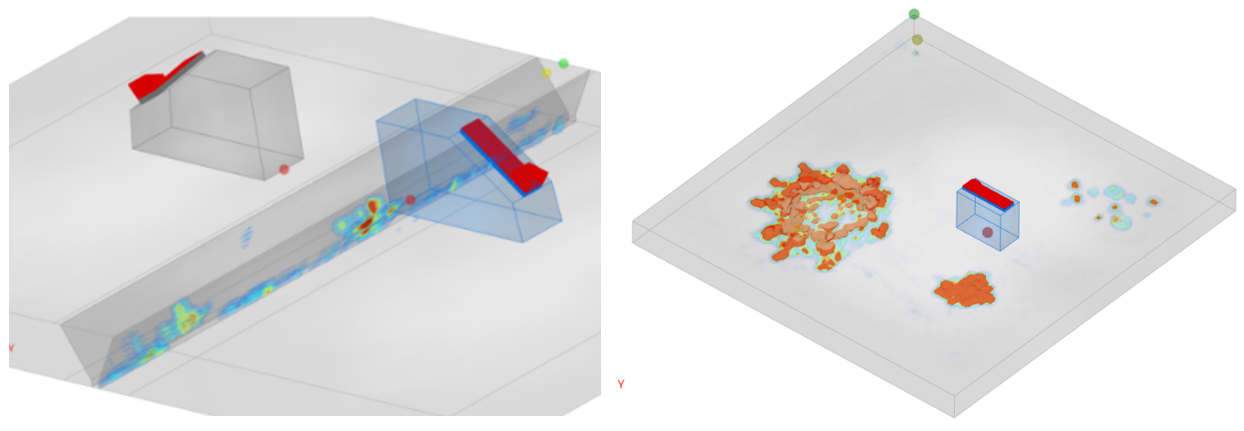
When performing corrosion mapping or composite inspection, it is sometimes difficult to inspect the entire component in one pass. While Capture doesn’t have any data file size limitations, it may be more convenient to perform scans in several steps due to accessibility constraints.
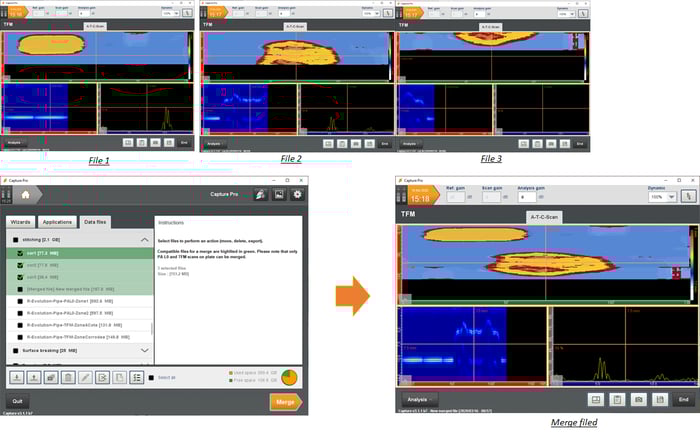
Capture now offers a stitching tool that allows merging various 2D mapping inspections. By selecting different files, Capture checks their compatibility (same type, transducer, etc.) and creates a larger file. Analysis can then be conducted on the large file. Capture considers the index and scan offsets to correctly reposition the various C-scans and recalculate the corresponding B-scans, D-scans, Topview, Sideview, etc.
The following image shows the stitching of a TFM corrosion mapping. Three files were acquired separately. The C-scans, T-scan and A-scans can be seen for each image at the top. From the Start menu, the inspector can select the three files; they appear in green to indicate they are compatible for stitching. The merge results in the data file at the bottom right with the complete cartography composed of the three C-scans with the combined T-scans.
The following video shows another example for two files obtained using a standard linear scan inspection.
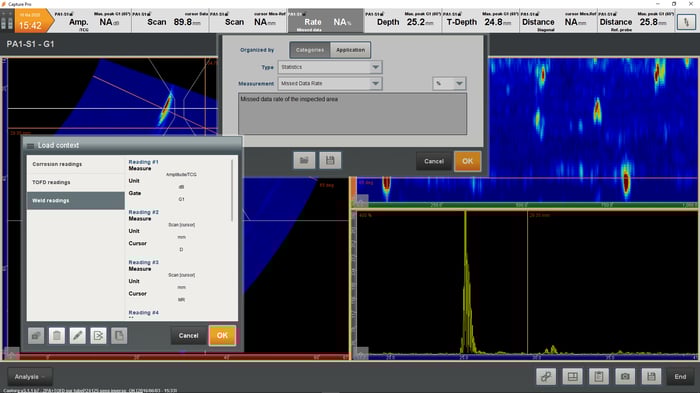
The banner of indicators at the top of the screen has been redesigned to offer more information. It is now possible to display up to eight indicators. Available both in acquisition and analysis, the new indicators provide all the information necessary for operators to characterize indications.
All the amplitudes (absolute, /ref, equivalent reflector, etc.), cursors (scan, index, weld center line, probe reference, etc.) or statistics (missed frame, material loss, minimum thickness in an area, etc.) can be displayed for single or multi-group configurations.
The banner is completely customizable, and templates can be created for operators to load their favorite indicators based on the application. Default banners are proposed for corrosion mapping, Time-of-Flight-Diffraction (TOFD) and weld inspections. The following image shows the weld inspection template.
Capture 3.1 introduces advanced analysis tools to help operators perform fast and efficient assessment of their inspections. These tools are available for the Gekko, Mantis and PC.
Download this guide on the seven questions you should ask when choosing your next phased array UT solution. Interested in learning more about the Total Focusing Method? Check out our webinar on how life is better with TFM. Finally, we’ve got a team of global experts that would love to answer your specific questions; get in touch today!