Capture, the driving force behind Eddyfi Technologies’ Gekko® and Mantis™ portable instruments as well as the Panther™ 2 industrial solution, is the pinnacle software for phased array ultrasonic testing and total focusing method. Constantly pushing non-destructive testing boundaries, Capture software version 4.1 introduces advanced capabilities, enabling operators to be the best inspector they can be.
Phase Coherence Imaging (PCI)
Phase coherence imaging is a technique based on evaluating the coherence between signals detected by all the elements of a phased array ultrasonic testing probe like the Full Matrix Capture (FMC), sparse FMC, or Plane Wave Imaging (PWI) techniques.
PCI imaging, a non-amplitude based technique, uses phase information rather than amplitude for detection and focuses on diffraction echoes instead of specular ones. The intensity of a PCI image varies with the indication type. Omnidirectional sources like porosities, tip diffractions, and slag exhibit high intensity, while reflectors with directional dependence like front surface, backwall, delamination, and Lack of Fusion (LoF) show low-value phase coherence. PCI aids in detecting volumetric defects and identifying crack tip diffracted signals for improved sizing; learn more about PCI in this blog.
Figure 1 compares TFM and PCI for High Temperature Hydrogen Attack (HTHA) inspection using a dedicated PAUT probe and PWI excitation. The sample contains stage 2 HTHA where the microcracks range from a few microns to 100 microns. The TFM image shows artifacts that are sometimes observed when performing L0 TFM inspections. These artifacts are caused by contributions from the backwall in the FMC/PWI raw data. As PCI removes specular echoes, it removes the artifacts and enhances diffraction off the microcracks. The HTHA damage is clearly visible in the PCI image and in the C-scan when compared to TFM.
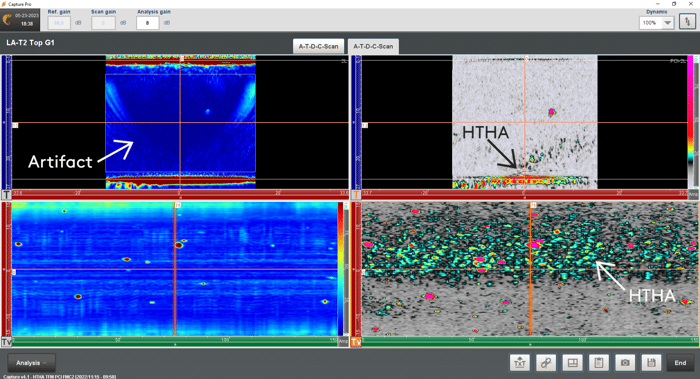
Figure 1: TFM and PCI for HTHA inspection using a dedicated PAUT probe and PWI excitation
PCI is also a valuable technique for detecting tip diffraction echoes. Figure 2 shows a multigroup configuration with two pulse/echo (left and right) and one pitch/catch (middle) groups for a 25-millimeter (1-inch) V-weld. We can see three defects in the results: root crack (top), toe crack (middle), and lack of fusion (bottom).
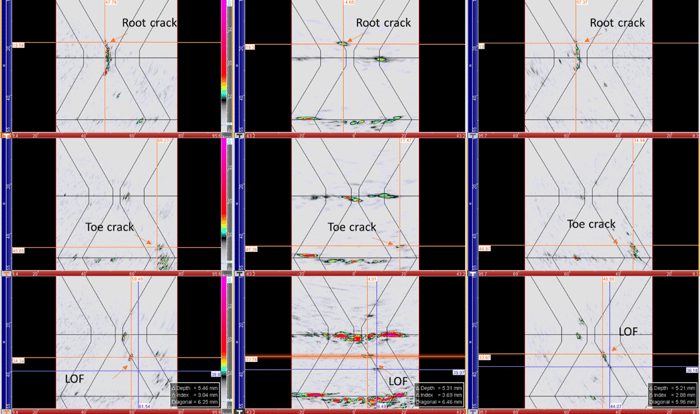
Figure 2: Multigroup configuration with two pulse/echo (left and right) and one pitch/catch (middle) groups for a 25-millimeter (1 inch) V-weld
The PCI images across all groups show clear tip diffraction at the edges of the three defects, allowing sizing. In the pitch/catch group, the backwall and front surface echoes tend to disappear as PCI minimizes specular echoes.
Capture software’s phase coherence imaging capabilities are compatible with FMC, sparce FMC, and PWI excitation modes. It also allows for utilizing the technique in a multigroup configuration, combining it with TFM. There really is nowhere for defects to hide now!
Pitch/Catch Face-To-Face
In most TFM inspections, a pulse/echo configuration is commonly used. This involves a probe emitting elements individually in an elementary FMC or using a sectorial scan for PWI, while the same probe receives the signals. Alternatively, TFM can be performed in a pitch/catch configuration where two probes are used: one probe emits, and the other receives, facing each other like a TOFD configuration.
Capture 4.1 enables pitch/catch acquisitions for TFM and PCI techniques using elementary or PWI acquisitions schemes. After adding a pitch/catch probe through the equipment settings, operators can access the pitch/catch configuration in the TFM settings and adjust the Probe Front Separation (FPS) for all wave types (L or S), mode paths, and excitations (FMC/PWI).
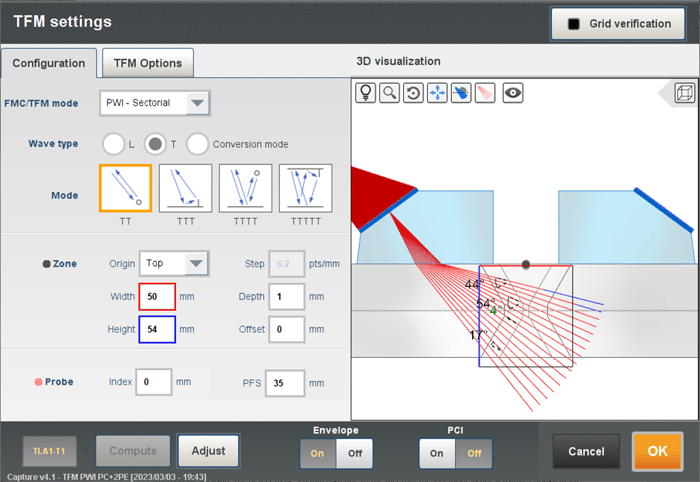
Figure 3: Capture software TFM setting options
The pitch/catch face-to-face configuration shares similarities with TOFD, making it highly sensitive to tip diffraction. Figure 4 shows pitch/catch results obtained using two 64L5-G3 probes with SW55 wedges. A TT mode is used with a region of interest covering the first and second legs. The results show an inner diameter (ID) notch following the bevel, an outer diameter (OD) notch following the bevel, porosities, and two defects centerline and a LOF-like notch.
Like TOFD, pitch/catch TFM draws the backwall and front surface echoes. They can be used to determine the FPS between the two probes. For a fixed FPS set in the TFM settings panel, an operator can physically move the probe to optimize the backwall echo. The right FPS is obtained when the backwall is maximum. Like TOFD, these echoes can also be used to see misalignment between two welded plates, preferential corrosion, and more.
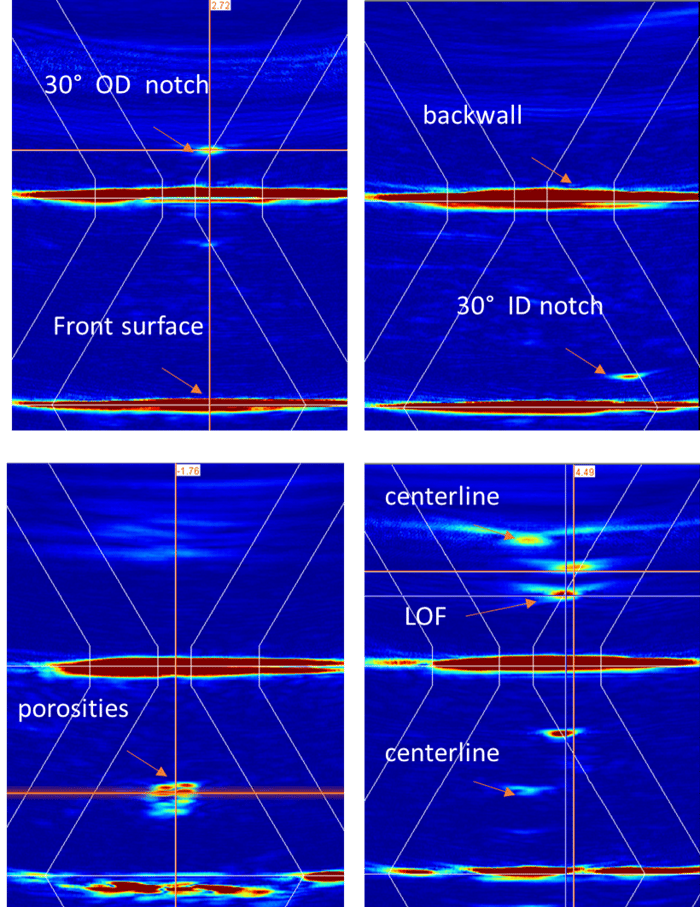
Figure 4: Pitch/catch TFM results obtained using two 64L5-G3 probes with SW55 wedges
Looking at the various indications, we can see that pitch/catch TFM provides diffraction echoes from all the defects either on the first or second legs just like TOFD would. The main difference here is that the ultrasonic energy is focused providing small echoes that make it easy to find the maxima and thus size defects properly. We can see the tip diffraction echoes from the ID and OD notches following the bevel, the top and bottom tip diffraction echoes from the LOF and centerline notch, enabling accurate sizing.
TFM Sensitivity Map
While TFM is mostly used with direct modes (L-L or T-T), it has the capability to use different modes of reconstruction to detect and image defects. By including reflections off the backwall and front surface, it is possible to image discontinuities from different directions. According to ISO 23865, planar defects are better detected with imaging paths where the incident angle and reflected angles off the defects are perpendicular to the defect; this can include mode conversions. The perpendicular nature of a mode to a planar defect depends on the probe position with respect to the defect, the probe aperture and frequency, and the type of modes used.
Capture 4.1 introduces a TFM sensitivity map that helps predict the capacity of a particular TFM mode to detect and image a defect. The TFM sensitivity map tool can be accessed in any 3D view during TFM calculation and analysis to determine the suitability of the mode chosen. It is compatible with both FMC and PWI. Talk about a gamechanger!
Figure 5 demonstrates the sensitivity map for TT mode with a point-like defect (left) and TTT mode for a planar vertical defect (right). The TTT mode is known for imaging vertical notches.
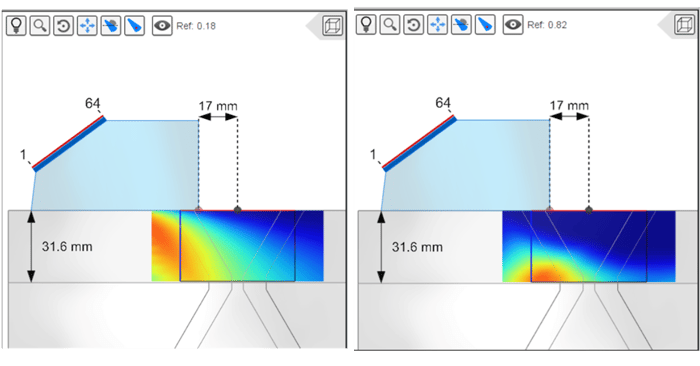
Figure 5: Sensitivity map for the TT mode with a point-like defect (left) and TTT mode for a planar vertical defect (right)
In this particular scenario, the sensitivity map reveals that the selected probe’s TTT mode is only sensitive to a limited vertical area of a defect. Consequently, the top portion of a larger defect would experience a rapid amplitude drop, leading to undersized defect measurements based on amplitude. We can see this in Figure 6 features the TT (top) and TTT (down) modes. The TT mode shows a corner echo and tip diffraction that can be used for sizing (7.1 millimeters (0.28 inches) high). The TTT mode draws the vertical notch. Although the -6dB sizing method is expected to measure the defect at 3.8 millimeters (0.15 inches) in height, it falls short due to the insufficient sensitivity of the TTT mode at the top of the defect. The sensitivity map helps predict this behavior – no crystal ball required.
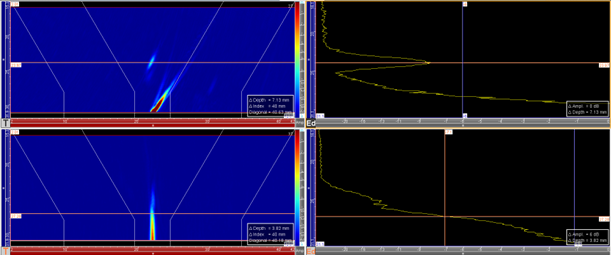
Figure 6: TFM for the same position, TT mode (up) and TTT mode (down)
TFM/PCI 2D Gates
Another cutting-edge feature that Capture 4.1 brings is 2D gates for TFM and PCI data analysis. Operators now have the ability to fine-tune not only the gate’s depth but also its precise position within the region of interest. This newfound control proves invaluable when focusing on a specific component area, while effortlessly sidestepping unwanted echoes in topview, sideview, and 3D exports.
The following images show a multigroup configuration with three TFM images exported into the 3D view. The view is dominated by the backwall and front surface echoes. In Figure 8, we can see the 2D gates in the TFM images displayed in red and their effect on the 3D export and the sideview.
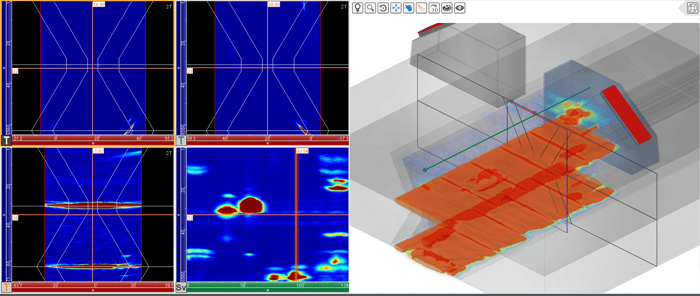
Figure 7: Multigroup configuration with three TFM exported into the 3D view
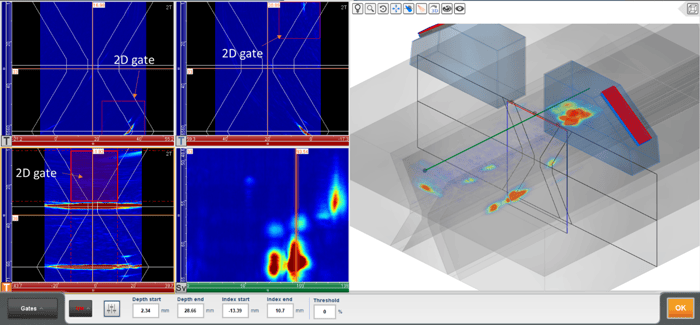
Figure 8: Multigroup configuration with three TFM exported into the 3D view with 2D gates in the TFM images shown in red
Just When You Thought The TFM Toolbox Couldn’t Get Any Better
Capture software 4.1 propels the most comprehensive TFM toolbox to unprecedented heights, empowering inspectors with unparalleled inspection methods and state-of-the-art data analysis capabilities. With enhancements to the scan plan and sensitivity map, operators can now effortlessly select the optimal inspection modes, achieve enhanced characterization through PCI and pitch/catch configuration, and ensure pinpoint accuracy with the precision of 2D gates. Elevate your inspections to unparalleled levels of excellence with Capture 4.1, setting new industry standards and redefining what's possible in flaw detection and analysis.
For more information on Capture software and our advanced PAUT and TFM offering, contact our experts today!