
Performing inspections on in-service flanges can be quite challenging when out in the field. There are variables that need to be understood and controlled when possible. Internal design alterations due to client specifications and material composition can often make interpretation of results time consuming. What makes things easier is pattern recognition on a representative drawing. In this blog, I’ll share my personal experience with Eddyfi Technologies Gekko® portable phased array ultrasonic testing tool featuring Capture™ acquisition and analysis software for better inspection of flanges commonly used in process facility equipment.
Just as we used to do with conventional ultrasonics and paper where you would draw out your piece, preferably to scale, and use overlay papers for beams, angles, depth, sound paths, etc., things that worked in early ultrasonic testing (UT) are still very relevant today. The ability to overlay data onto a representation makes interpretation of great data easier. With phased array UT (PAUT)/Full Matrix Capture (FMC), we have a lot of data available to us, and with higher sensitivity to defects comes challenges with signal recognition. Patterns can more readily be seen with encoded data, and now determining where those signals match up on a physical piece allows for a much higher level of confidence during and after inspection.
I have heavily been using the Gekko for four years now, and I cannot begin to explain how useful many of the features are. With Capture software version 3.2, these features have only been improved upon. For example, now you can load DXF files from third party software which allows the visualization of data on complex parts. Technicians can now make data interpretation at the field level more streamlined with overlays denoting where signals are originating from, with the same 3D model clearly showing the data plotted onto the component.
In this video, we take a look at how to import DXF files into Capture in order to overlay data on them for easier interpretation and confirmation of results. For more informative videos like this one, follow me on LinkedIn.
When introducing a client to the new age of phased array and FMC data, it can be a bit daunting. Familiarity with PAUT/FMC data is still limited in many sectors of the business world but continues to get better. With that, better data output makes better decisions—decisions that are both auditable and repeatable. A client who has never been exposed to a type of inspection, or data presentation, or inspection method has a much higher chance of understanding the data output with a tangible reference point such as a 3D model of the component that was inspected. Utilizing tailored 3D images has allowed me to verify patterns from geometry, defects, and mode conversion “noise”.
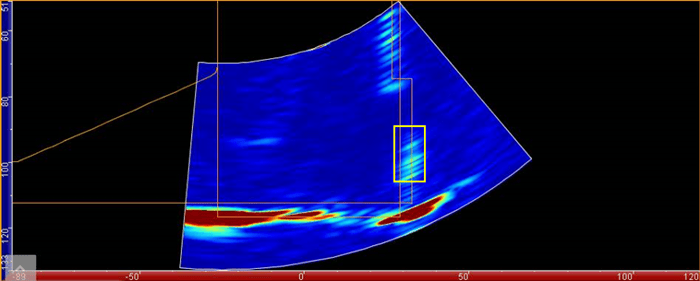
The following image shows a weld beck raised face flange with no damage. You can see the reflections generated from the upper part of the flange above the raised face, as well as the raised face itself. The location in the yellow box shows positioning of the gasket sealing surface. The image shows excellent coverage of the area of interest, verified by the soft indications denoting the geometry and proving sensitivity to very fine defects. This allows easy verification of signals and displacement for defects.
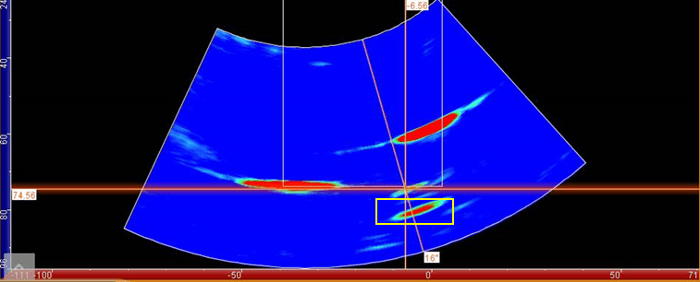
The next image is from an RTJ (ring joint) flange. The bottom corner with the cursor shows the corner trap at part thickness. The reflection below that, shown in a yellow box, is outside of the part thickness but is an integral part of the inspection. Without the added 3D image, it is difficult to assess what exactly that signal comes from. The added benefit of the Gekko, even since previous software versions, is the flip feature.
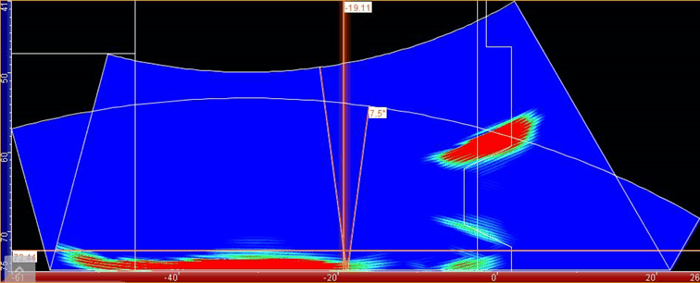
The image below is the same image as above but done in the beam display mode “V-Transmission”. This validates the signal is from the second leg and is actually from the bottom side of the ring groove.
For client reference, without additional requirements, or in the case of auditing purposes if the reports are not contained with the data, the best way to image this is to overlay all of this from the start on the specific flange .DXF file. This allows quick verification for the displacement of peculiar signals.
Frequency of flange inspection remains constant so the ability to open files and trend on even small changes in erosion or corrosion against the 3D representation makes analysis that much more precise enabling proactive decisions. Being able to manage inspections in service without the need to open flanges to visually verify internal conditions has made it easier to plan inspections for those busier shutdowns, and more pre-shutdown work offers a safer option when trying to keep people on site to a minimum.
A picture is worth a thousand words and given the critical role that flanges play in demanding process equipment, it’s important to get the whole story. Thanks to the Gekko with Capture, operators can feel confident in making decisions regarding their asset health management programs.