
In a world where time is money, you can’t always afford to wait for post-processing results to make structural integrity assessments of capital assets and critical components known to be used beyond their intended design life.
If you’re in the market for a new ultrasonic testing (UT) tool, you’ve likely heard the Total Focusing Method (TFM) buzzword when researching advanced phased array UT instruments. Developments in Non-Destructive Testing (NDT) technology have resulted in an increase of TFM enabled devices now commercially available. Full Matrix Capture (FMC) is a data acquisition strategy that takes advantage of Phased Array Ultrasonic Testing (PAUT) by collecting all possible transmit-receive combinations in a transducer. This large volume of data is then processed by the increasingly popular TFM technique. Pioneering real-time TFM since 2013, we weigh in on why you should consider a flaw detector that allows operators to display real-time TFM A-scans.
First, let’s recap the key difference between Phased Array Ultrasonic Testing and Total Focusing Method: they employ unique signal acquisition strategies and image processing. Is one better than the other? PAUT and TFM may offer equal or improved detection capabilities depending on the type of inspection being performed. With PAUT, inspections are generally unfocused and could be less effective for detecting smaller defects. On the other hand, TFM produces an image where each pixel is the result of a focused beam. This makes TFM the ideal candidate for detecting small defects such as High Temperature Hydrogen Attack (HTHA), solitary inclusions or porosities and crack-like defects thanks to an improved sensitivity of tip diffraction echoes.
You want to make sure you’re getting the most bang for your buck, and in the NDT world that translates into an instrument that goes beyond simply complying with today’s codes and standards to a dynamic tool designed for tomorrow’s inspection requirements. It’s in these details that help you move from data collection to analysis more efficiently: see the problem sooner, solve it faster, and get to the next job.
Analysis measurements are generally performed to obtain information on the size, volume, location, and configuration of detected flaws. Volumetric flaws are typically sized using amplitude-based methods while planar flaws such as cracks are characterized using a tip-diffraction method. More information on flaw dimensions are obtained by analyzing scans in different directions (i.e., parallel, perpendicular). In all cases, inspectors need to have access to A-scan signals to measure any amplitude information. The M2M Gekko® and Mantis™ portable flaw detectors display real-time TFM and all the necessary views —A-scan, D-scan, C-scan, echo dynamics, sideview and 3D view— through an intuitive interface aptly called Capture™. Cursors and indicators available for PAUT inspection are also available for TFM allowing fast and efficient inspection and analysis.
To illustrate these features, we look at the assessment of a weld inspection. The test piece is a 9.5-mm thick V-weld inspected with a 64L5-G2 probe and an SW55 wedge. The dimensions of the TFM Region-Of-Interest were selected to cover the weld on the first and second leg; i.e., the TT and TTTT modes simultaneously. The number of pixels was selected using the amplitude fidelity required by standards (ASME V Article 4) to preserve the peak amplitude information. While a theoretical criterion of λ/5 may be sufficient, we used the amplitude fidelity tool explained here. This allowed us not only to keep the amplitude of any reflector stable within 2 dB but also minimize the number of pixels to obtain the best productivity possible for this setup. Using this criterion and the Fast Mode for FMC/TFM, the scanning speed was 90 mm/s, taking data points every 1 mm.
Capture can display up to four layouts allowing operators to visualize many views for inspection or analysis. The following image displays a T-scan, D-scan, C-scan and A-scan. The banner of indicators on top of the screen can display up to eight indicators.
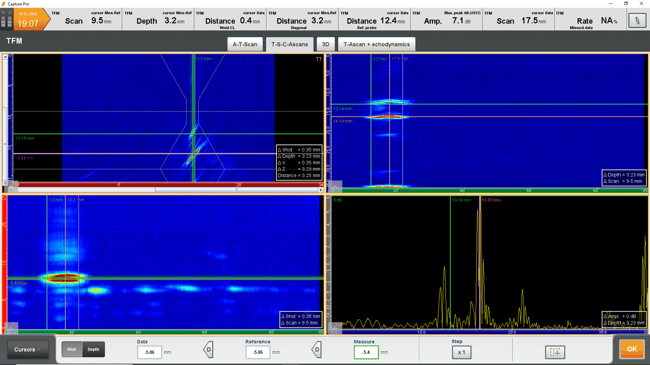
The V-weld contained an indication clearly visible in the D-scan and C-scan views. The T-scan shows that the indication is a centerline crack detected on the second leg; i.e., the TTTT mode. Being a planar defect, we used tip diffraction to size the defect height. Using the 3-cursor tool (bar at the bottom), we moved the data cursor to find the peak amplitude of the bottom tip diffraction, positioning the reference cursor there automatically. We then looked for the maximum top tip diffraction to position the measurement cursor automatically. The distance between the reference and measurement cursors provides the height of the defect with information visible in the top banner as well. Let’s point out that thanks to TFM focusing capabilities, tip diffraction echoes are detected with a Signal-to-Noise Ratio (SNR) of 23 dB and 27 dB for the top and bottom tips, respectively.
The length of the crack was measured using the amplitude drop method, with respect to the maximum indication response, while moving along the scan axis using the same 3-cursor tool and amplitude information measured in the A-scan view. We can clearly see the importance to have access to views such as the A-scan or C-scan when performing TFM inspections. Defect characterization is made easy and fast for TFM inspections using tools that operators are already familiar with.
The Gekko continues to differentiate itself with its offering of TFM A-scans (and other views) for live interpretation and further analysis. This is just one detail. Download this guide on the seven questions you should ask when choosing your next phased array UT solution. Interested in learning more about the Total Focusing Method? Check out our webinar on how life is better with TFM. Finally, we’ve got a team of global experts that would love to answer your specific questions; get in touch today!