
Why Spot-Checking Tank Shells or Tank Roofs for Corrosion is Not Sufficient
The prediction of how and where corrosion exists on tank shells and roofs is rather tricky to determine. It is influenced by many parameters such as tank contents, environment, weather conditions, loading and offloading rate, and much more. Therefore, it is vital to get excellent and representative data over large sections of the tank surface. With spot checks, this is not possible because it provides a limited number of data points on a measurement scanline. These scanlines are described in inspection guidelines such as EEMUA 159 or API 653.
Corrosion can be very localized and present itself in horizontal corrosion patterns as seen in Figure 1.
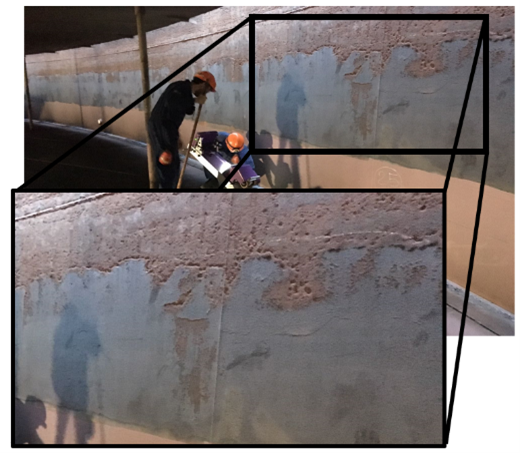
Figure 1: Tank corrosion pattern
In this case, the corrosion pattern extends around the circumference of the tank on the bottom course 20 to 30 centimeters (8 to 12 inches) below the weld. When in-service spot checks are performed on the outside of the tank, the chances of missing defects would be significant. A B-scan scanline crawler such as Scorpion 2 likely would have detected and registered the small corrosion spots. If these spots can be seen on all scanlines taken around the tank surface, the corrosion pattern would also be detected. Once found, the decision could be made to increase the inspection with an even more dense inspection data system such an automated solution.
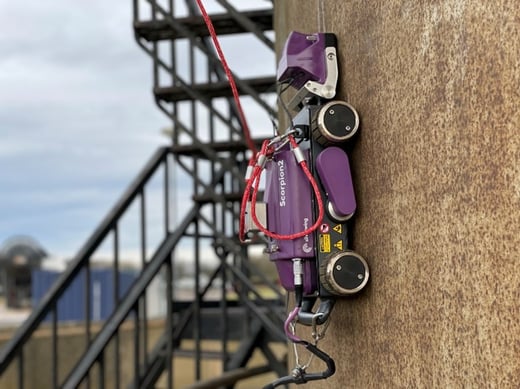
Figure 2: Scorpion 2 performing in-service tank inspection
How the Scorpion 2 Tank Inspection Crawler Has You Covered
Not only does Eddyfi Technologies’ Scorpion 2 crawler provide a complete B-scan scanline of the tank shell and roof thickness, but also handles this task much more efficiently than any other inspection method.
One of the reasons for this is that the Scorpion 2 crawler can inspect 180 millimeters (7 inches) per second. This means that on a 22-meter (72-foot) tall tank, a scanline would take a little over two minutes. As the Scorpion 2 collects data every 1 millimeter (0.04 inch), a total of 22,000 data points are available to evaluate the wall thickness condition on that single scan. As we can see in Figure 3, the data presented in an Excel graph clearly demonstrates how the tank wall thickness is distributed along the vertical axis of the tank. Collecting such a high number of data points poses a new challenge when it comes to reporting on the data, but we’ll come back to that shortly.
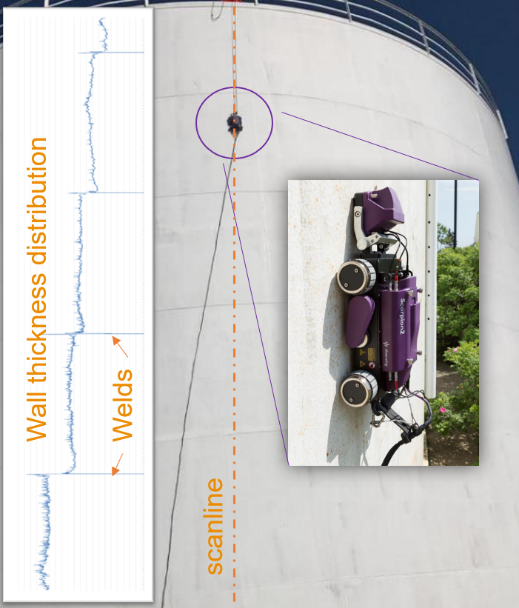
Figure 3: Inspection scan setup and data
The value of high-density data can already be seen by the line-graph shown in Figure 3. Next to high inspection speed, the Scorpion 2 crawler also has several other features that make this system a unique storage tank inspection tool. One of the most valuable properties is the dry coupled roller probe, also called DCP. The rolling nature of the probe and the materials used for the probe interface make it possible to travel and inspect at high speeds without water irrigation. The data collection software, Swift-UT, also has several unique features. Two of these involve intelligent gates. The first bespoke feature is the floating gate. A floating gate allows for variations in signal response (dB) and adjusts the gates accordingly so that the reading within the gate is accurate even with fluctuating signal responses. The second gate feature is the tracking gate option. This gate option allows for automatic repositioning of the second gate based on the value read in the first gate. These features allow the tank inspector to measure the wall thickness of the tank shell or roof without stopping to recalibrate or change system settings, therefore offering unrivalled productivity.
The Scorpion 2 is also entirely battery operated, allowing for easy non-irrigated deployment anywhere in the field.
Figure 4: Scorpion 2 effortlessly crawls up tank shell
Remote B-scan Data Collection
As previously mentioned, the Scorpion 2 is what we call a B-scan scanline crawler. The data that is displayed and stored on the Swift-UT instrument consists of A-scan data and metadata like gate settings and gate values. There are two ways of presenting this data: in a raw format like the A-scan itself, as well as the B-scan data which is a summary of all A-scans within one scan.
The A-scan data displays the time of flight of the ultrasonic testing (UT) signal for a single shot. Here we can evaluate if the measurement point is valid based on its position and state when passing the gate.
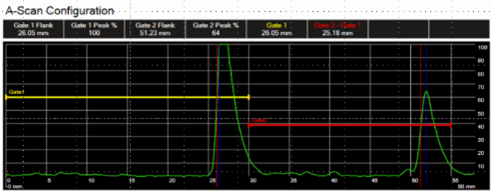
Figure 5: A-scan graph
A B-scan displays the intensity of the UT signal responses for all of the collected A-scan data within one view. The benefit of the B-scan view is that any abnormalities in wall thickness measurements can be easily identified. It also highlights if a second or possibly more repeat responses (echoes) are available, indicating that second gate data interpretation is possible.
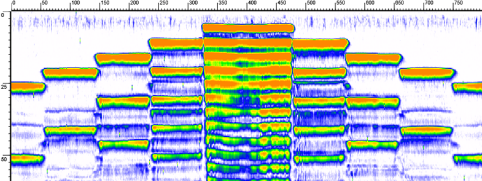
Figure 6: B-scan graph
The presence and use of a second gate can be helpful in the true evaluation of the aboveground storage tank shell or roof integrity. The first gate values can be influenced by the tank coating, and as such, second gate values are considered more accurate as the velocity effects of the paint are not present in the second gate value.
A tank inspection scanline consists of data from each millimeter position of the tank integrity assessment. Take the same 22-meter (72 foot) tank with 22,000 data point example from earlier. Based on the tank diameter, there could be 8 to 16 scanlines for each tank inspection. As mentioned, we strive to collect data on both gate 1 and gate 2 to eliminate the paint thickness effects. In the case of an 8-scanline tank inspection with 22,000 points per scanline, we multiply 8 scanlines by 2 gate values to equal 352,000 thickness reading points. Reporting this much data can be a challenge. To overcome this, Eddyfi Technologies developed an Excel macro that summarizes the data and creates a detailed report.
Inspection Data Reporting Using an Excel Macro
If we were to interpret the data from the Swift in non-graphical formats like A-scan or B-scan, then we would have to go through many thousands of data points manually. This process would be time-consuming and very prone to error; the best approach is to summarize the data into areas of interest. These areas of interest can be compared with the spot check positions that would have otherwise been collected. The main difference here is that the area now contains the true minimum, average, and maximum thickness for that specific point. This ensures that any possible corrosion spots are not missed.
As we collect a significant amount of data while driving a Scorpion 2 crawler up a tank shell or roof, we also collect non-valid data. Non-valid data is caused by signal interruptions. These signal interruptions can be caused by several factors such as loose paint, debris, poor signal coupling, etc. To achieve an ideal evaluation, we need to filter out any insufficient quality data that might be present.
The Excel macro uses the Swift-UT option to export the data in an Excel format. This export of data is read into the macro file. The first thing the user must do is identify the location of the welds in the collected data. This way, the macro knows which tank course parameters are valid for that data section. Once done, the user can enter the parameters for each course in the settings tab as seen in Figure 7.
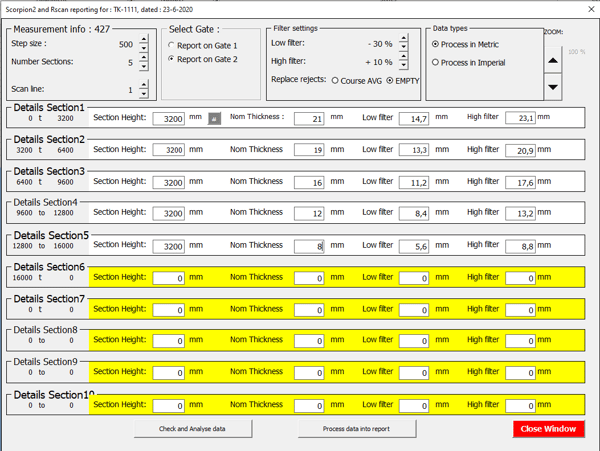
Figure 7: Excel reporting configuration options
On the settings tab, the user can adjust the area for summarizing data; this could be an area of 500 millimeters (20 inches), for example. The user can also determine whether the gate 1 or gate 2 data is available for the wall thickness distribution graphs. The macro gives the user an option to enter a generic calculation of the low and high filter based on the nominal thickness of each course. The setting required for each tank course is the section height, nominal thickness, and the high and low filters. Once this information is known, the user can process the data into a summary sheet.
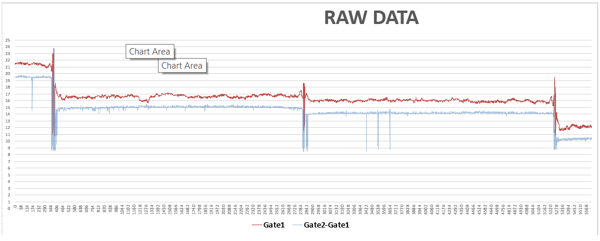
Figure 8: Tank inspection data processed
From the summary sheet, the data is linked to a report format that the user can create. With options to save and export the report as a PDF or print it, the user has multiple options for sharing the final tank inspection report with the asset owner.
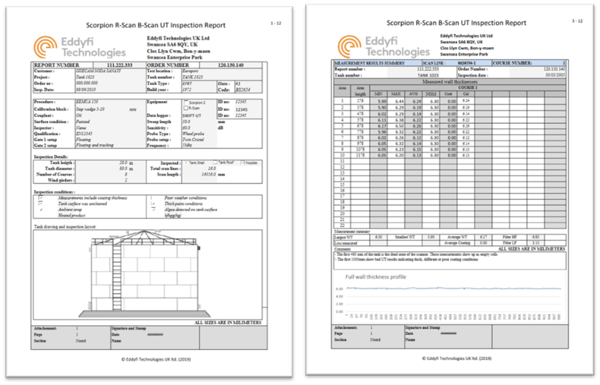
Figure 9: User configurable final tank inspection report
Scorpion 2 Delivers Higher Productivity in Tank Inspection Reporting
If you are interested in learning more about futureproof and highly productive inspection methods for better tank inspections, contact our friendly and knowledgeable NDT experts.
Did you know we also offer online training through the Eddyfi Academy? This course contains everything you need to know in order to operate the Swift UT and Scorpion 2 crawler, including hardware, setup, calibration, scanning, analysis, and more.
And if you haven’t already discovered the Eddyfi eStore, gain instant access to pricing by building and configuring the Scorpion 2 here. Hey, we told you we’re committed to keeping you productive!

Figure 10: Scorpion 2 inspecting tank roof