
1996: TomoView, the First Release
In 1996, a company called R/D Tech released TomoView, the first version of the NDT inspection software. At that time, TomoView was designed primarily for the nuclear power generation market. Its early versions were limited to the analysis of multi-channel conventional ultrasonic testing (UT) data.
1999: Introduction of PAUT Data Acquisition & Analysis
In 1999, TomoView 1.4 was introduced, which allowed the setup, acquisition, and analysis of phased array UT, or PAUT, inspection data with TomoScan Focus. This was a gamechanger for the industry, pioneering a brand-new NDT market.
2004: R/D Tech's Energy Division Purchased by Zetec
In 2004, R/D Tech's energy division was acquired by Zetec. This division contained the TomoView development team. Zetec has continued the development of the software under the name UltraVision 1.
Early UltraVision Key Features
Key features of the software in the early years include an advanced PA calculator 1.1 with graphical user interface (GUI) and support of dual matrix array (DMA) probes, online fast Fourier transform (FFT), an indication table, and volumetric merge feature.
And while the following image indicates just how far back in time we’ve journeyed, the focal law calculator was a pioneering technology that offered advanced capabilities for generating focal law delays. Its graphical display of the probe configuration was a novel feature that allowed users to verify and validate inputs and resulting focal laws for various array types. Furthermore, the calculator provided detailed numerical information for each delay law, including the position of the beam exit point and focal point, beam refracted angle, and skew angle. Its sophisticated capabilities were truly ahead of their time.
.png?width=1159&height=607&name=Advanced%20PA%20Calculator%201.1%20with%20Graphical%20UI%20and%20Support%20of%20DMA%20Probes-1%20(1).png)
Figure 1: Advanced PA Calculator 1.1 with Graphical UI and Support of dual matrix array (DMA) Probes
Volumetric merging, a process that allows for merging ultrasonic data acquired with various acoustic beams, was also a novel feature during this era. This process involved comparing the amplitudes obtained in each point of the inspected volume by the considered channels and/or focal laws and creating a new data group with the maximum amplitude observed at each position in the inspected volume. The ability to perform such a process was a major advancement in ultrasonic testing technology and opened up new possibilities for inspection and analysis.
How UltraVision Software Advanced Nuclear Inspections from 1996 to 2004
Dissimilar Metal Piping Weld Inspection
During this same time period, UltraVision software emerged as a game-changer for the power generation sector with the first-ever performance demonstration initiative (PDI) qualified procedure for phased array UT on dissimilar metal welds (DMW) in nuclear power plants achieved in collaboration with Electric Power Research Institute (EPRI).
As a technical presentation in 2012 would later confirm, Zetec continuously worked with EPRI to push back the limits of challenging applications. Using lessons learned from years of field experience, they qualified an improved solution for encoded phased array UT examination of dissimilar metal piping welds, using either the ZIRCON® or the powerful DYNARAY® instrument. Controlled by the industry-leading UltraVision software, these state-of-the-art instruments allowed for better focusing, improved data quality, and increased inspection efficiency. The procedure for encoded phased array ultrasonic testing covers flaw detection, length, and through-wall sizing in dissimilar metal piping welds from the outside surface. The applied inspection techniques are based on 1.5 MHz 2D matrix array probes. The scope of the procedure ranges from small diameter nozzles up to the heavy-wall safe-end to nozzle welds that connect steam generators to the main coolant piping.
From years of site experience, the following conclusions were drawn:
- Dual 2D phased array methodology provides very good inspection capability on both circumferential and axial flaws in dissimilar metal pipe welds, for a large range of diameters and thicknesses
- Encoded inspections, using either manually driven or fully automated scanning mechanisms, generate quality inspection data, allowing for reliable detection and accurate length and through-wall sizing
- New generation phased array UT hardware and advanced software had been developed and formally qualified, improving data quality and inspection efficiency
Learn more with this application note on addressing stainless steel and dissimilar metal weld inspection with advanced phased array ultrasonic techniques.
CANDU Feeder Inspection
UltraVision was particularly useful for CANDU feeder inspections in the nuclear power industry. It provided state-of-the-art non-destructive evaluation (NDE) solutions, setting a new standard for cost-effective and reliable inspections of power plants worldwide. Customers relied heavily on Zetec ultrasonic scanners to assess the condition of their critical infrastructure, ensuring their safe operation and longer, more productive lifetime.
Zetec offered off-the-shelf systems for both feeder wall thickness measurement and crack detection, as well as customized inspection solutions and methods tailored to specific needs. The carefully integrated acquisition systems included control hardware, ultrasonic testers, and proprietary standard-setting data analysis software for seamless field deployments.
The CANDU package option was an exclusive feature of UltraVision software, designed specifically for feeder tube inspections. It offered quick and easy visualization of the wall thickness map with accurate positioning of ultrasonic data. Additionally, it provided a dedicated tool for advanced thickness measurement analysis, including cross- and auto-correlation (equivalent to FAATS-COG), enabling analysts to retrieve precise thickness information at any location.
Moreover, the UltraVision CANDU software package included automatic scaling of the amplitude color palette, improving the contrast of displayed images and providing better data visualization. The post-processing wall thickness map definition feature enabled the generation of a new thickness map after the data had been validated by the analyst and could be displayed on the feeder tube 3D model. A-scans could also be exported in a format compatible with FAATS-COG.
UltraVision software with the CANDU package option offered cutting-edge technology and comprehensive solutions for nuclear inspection applications, ensuring accurate, reliable, and cost-effective inspections of CANDU nuclear power plants worldwide.
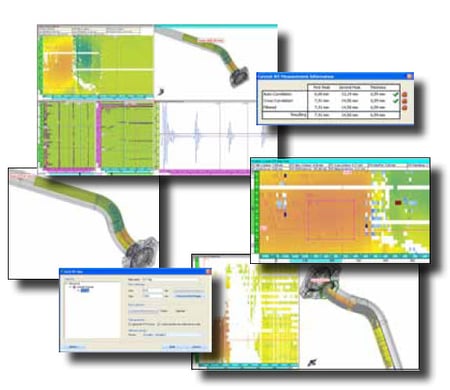
Figure 2: Dedicated UltraVision Tools for Feeder Tubes
2008: UltraVision 3 Unleashed
Fun fact: UltraVision 2 never existed.
In 2008, UltraVision's software code received a complete overhaul, bringing UltraVision 3 to the market. Paired with the DYNARAY acquisition system, this enabled market diversification.
But before we move on from the nuclear sector, it is worth highlighting the development and implementation of advanced UT techniques in lieu of manual UT and radiography for the inspection of narrow gap welds during manufacturing of primary component circumferential welds. And while we’re at it, why not review the improved inspection of large, forged rotors thanks to UltraVision?
Nuclear Vessel Thick Weld Inspection
The manufacturing of steam generators (SG), pressurized water reactors (PWR), and reactor pressure vessels (RPV) involves volumetric NDT inspection of circumferential welds. These are narrow gap welds (NGW) up to 16 meters (52 feet) long with a wall thickness from 100 to 200 millimeters (4 to 8 inches). UltraVision software provides all the tools for an efficient inspection workflow, during setup, calibration, inspection, and data evaluation. Powering a customizable data acquisition system and inspection robot allows for a fully mechanized PAUT and TOFD inspection on a large range of thick narrow gap vessels after manufacturing.
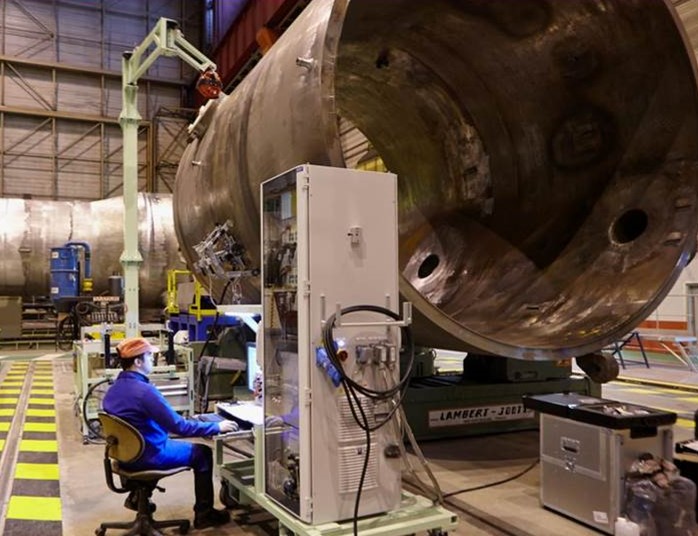
Figure 3: Thick Vessel Weld PAUT and TOFD Inspection
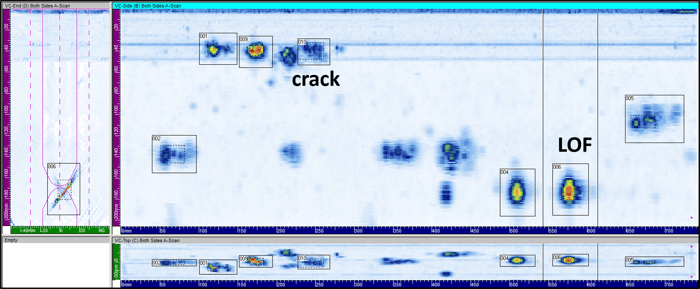
Figure 4: Ultravision Data
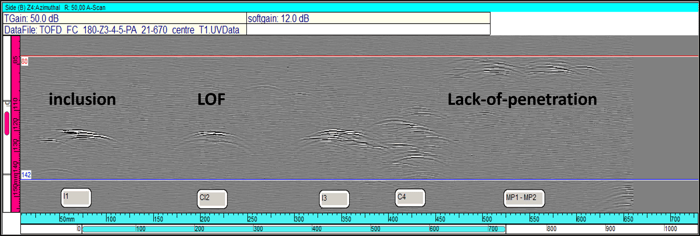
Figure 5: Ultravision TOFD Data
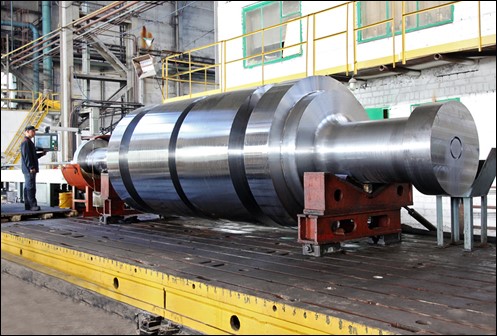
Inspection of Large Rotor Shafts with Semi-Flexible PAUT Probe and DGS Tools
UltraVision software is a key driver in improving inspection quality and efficiency, making it a valuable tool for nuclear rotor inspections. Large semi-flexible PAUT probes offer superior performance compared to conventional and rigid UT probes due to higher acoustic energy transmission, better focusing, and more efficient coupling; a single PAUT probe can meet the detectability requirements for straight and angle beam examination. With high-performance phased array hardware and this single software package, this technique can be efficiently applied in industrial conditions, resulting in a significant reduction of total inspection time while meeting code requirements.
Future Forward UltraVision Features
The evolution of UltraVision software saw the realization of many key features, including a 3D work environment for inspection technique development and data visualization, full matrix capture (FMC) raw data recording and offline reconstruction with DYNARAY, time reversal inspection technique for complex composite parts, and corrosion inspection using NDT Paintbrush scanner.
3D Work Environment for Inspection Technique Development and Data Visualization
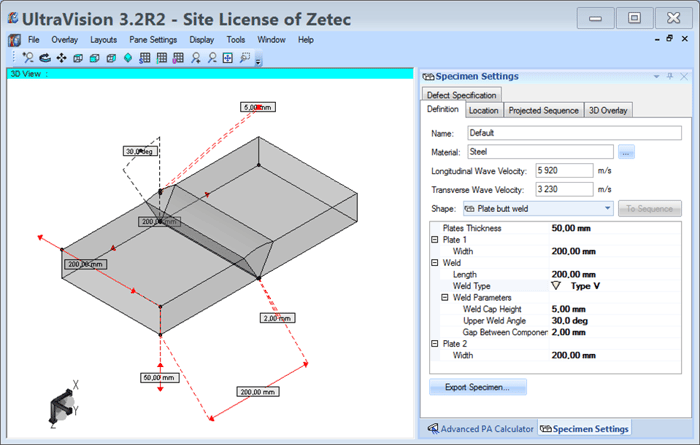
Figure 6: Pre-defined welded component, can be parameterized by operator
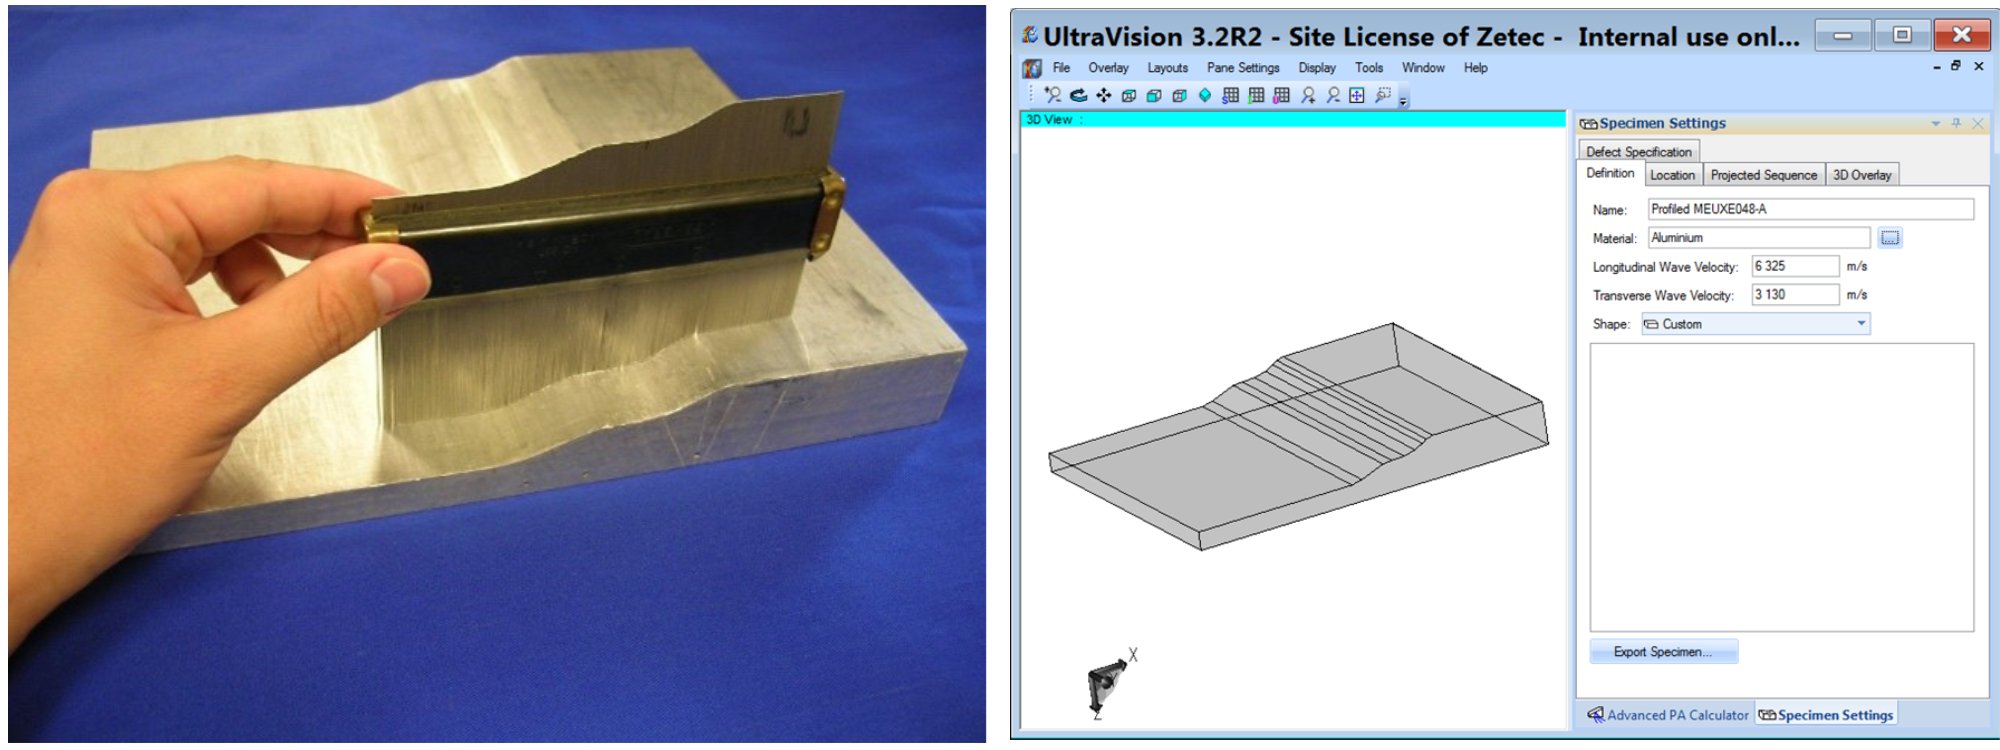
Figure 7: 3D specimen (right) generated by importing replica from manual profiling tool (left)
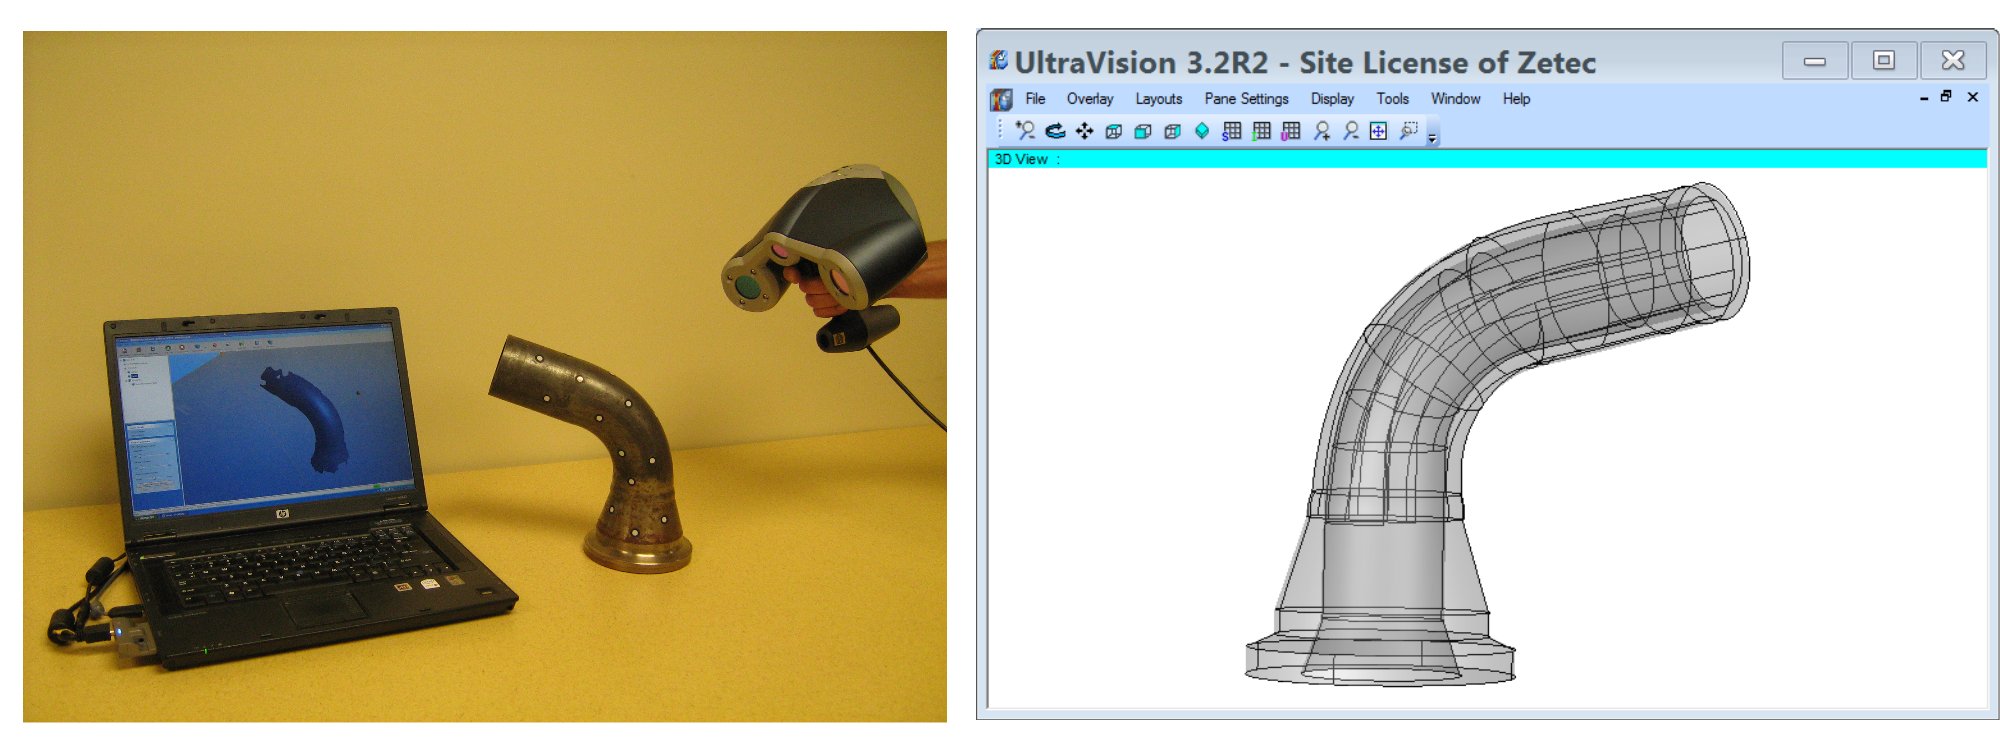
Figure 8: Grayloc of CANDU reactor feeder tubing: component with 3D laser scanning device (left, courtesy of Créaform), generated CAD file (right)
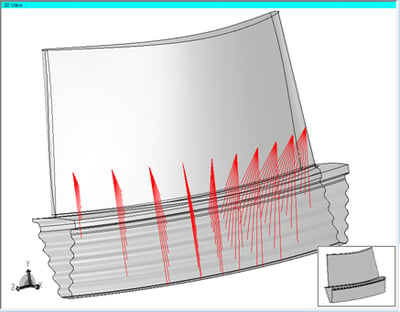
Figure 9: “Azimuthal” set of rays, insonifying turbine blade root attachments
%20versus%20optimized%20rays-1.jpg?width=700&height=315&name=Saddle%20weld%20inspection%20technique%20development_%20default%20rays%20(red)%20versus%20optimized%20rays-1.jpg)
Figure 10: Saddle weld inspection technique development: default rays (red) versus optimized rays (Blue)
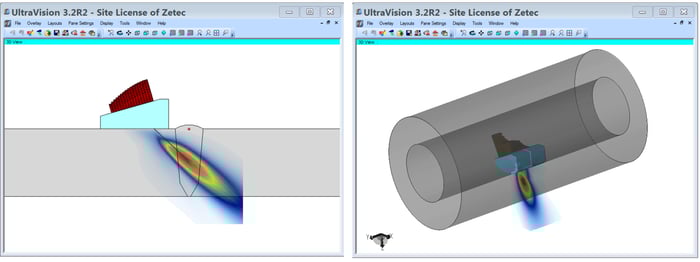
Figure 11: Acoustic field simulation of low-frequency dual 2D matrix arrays
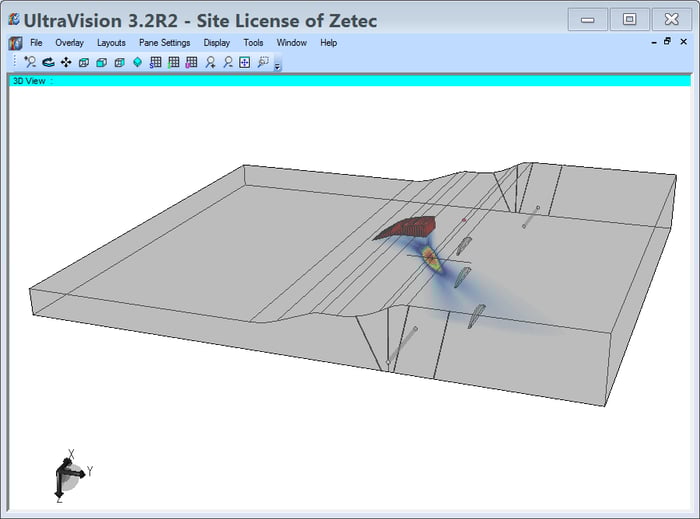
Figure 12: Acoustic field simulation of flexible array probe
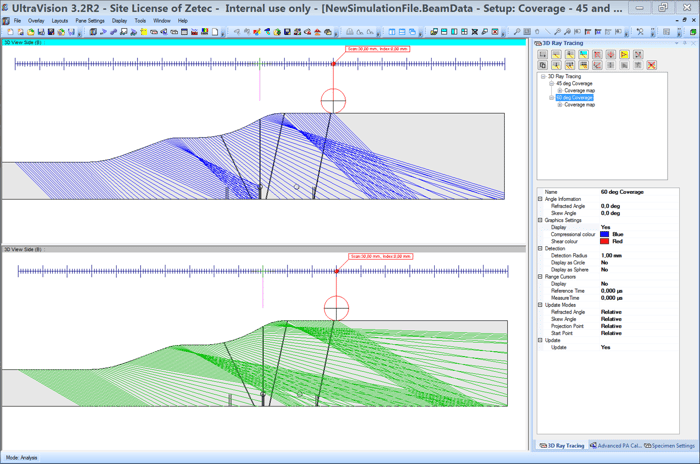
Figure 13: Examination coverage map of tapered component: 45°LW (in blue) and 60° LW (in green)
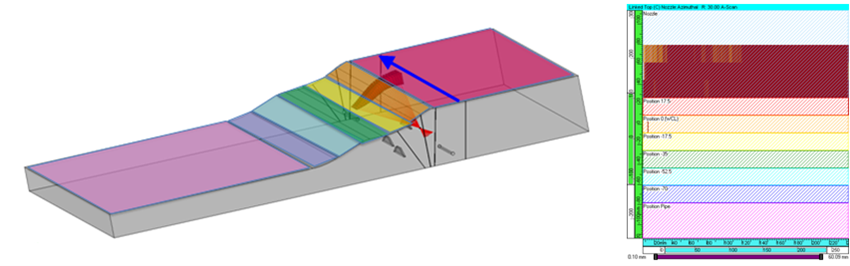
Figure 14: Definition of the “regions” on a tapered specimen surface
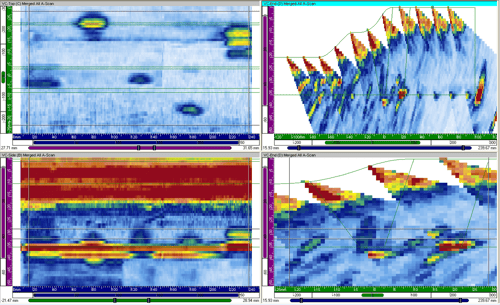
Figure 15: Actual UT data acquired with flexible array on tapered specimen using the position dependent focal law groups tool
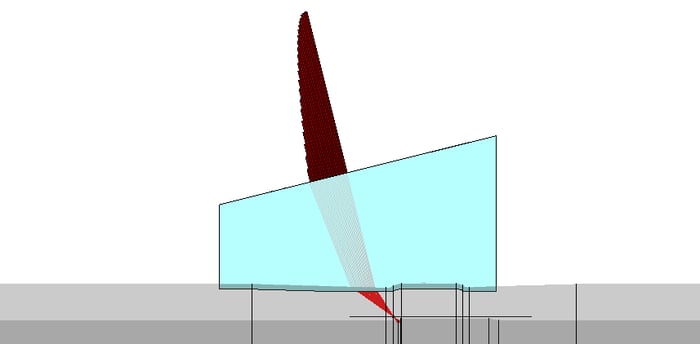
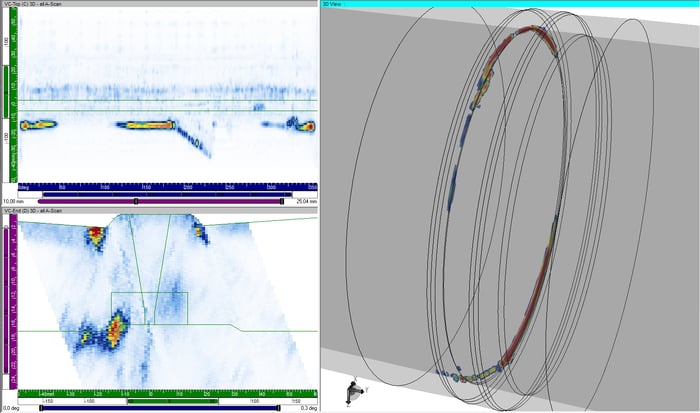
Figure 16: Phased array UT data recorded on pipe weld with as-built weld crown (Courtesy of EPRI)
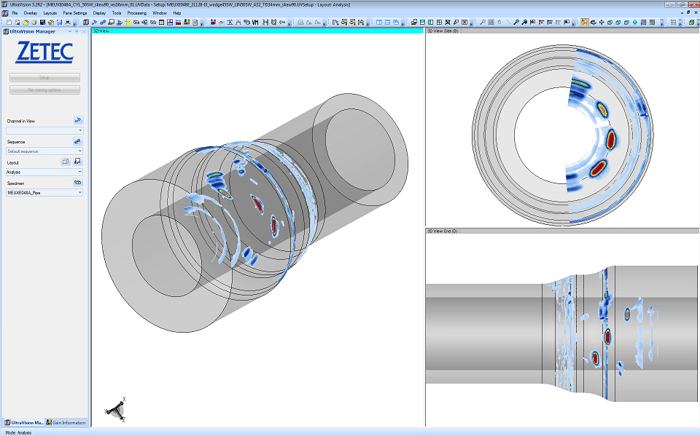
Figure 17: 3D Visualization of Large Rotor Shaft Examination data
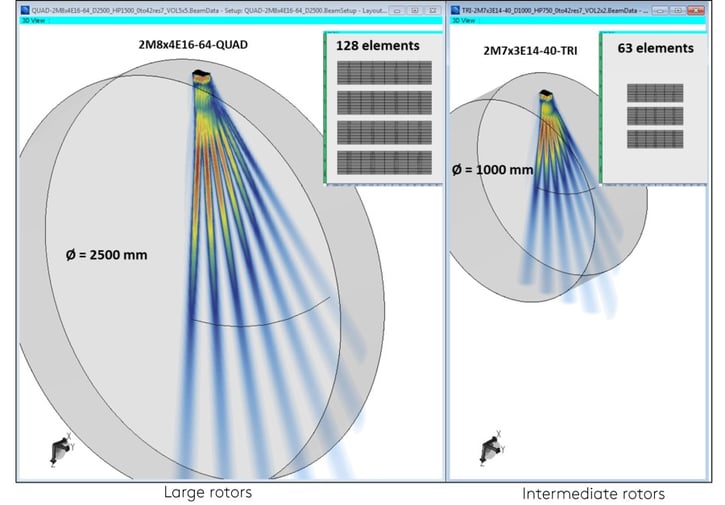
Modeling and simulation play a crucial role in the design and development of phased array probes for ultrasonic testing. Accurate CAD models are necessary for successful technique development, and 3D ray tracing and acoustic beam simulation are used to determine and assess focal laws. Position-dependent focal laws are essential for complex surfaces, and UltraVision’s enhanced 3D UT imaging improved examination data interpretation.
FMC Data Recording and Offline Reconstruction with DYNARAY
Back then, the full matrix capture technique was an emerging application of phased array technology that showed promise. FMC involves recording all possible time-domain signals (A-scans) from every transmitter-receiver pair of elements in the array. The recorded raw data can then be used to generate the data resulting from any given beam (aperture, refracted/skew angles, focusing position) through offline processing. FMC is valuable because it allows for the optimization of phased array summation offline during analysis, which can prevent costly re-scans.
To illustrate this, consider the example of a standard PA search unit placed at a fixed position on a calibration block with side-drilled holes (SDH). Using a standard PA process, some SDH can be detected with an azimuthal (or sectorial) scan from 40° to 70°SW. At the same time, FMC data is acquired. By summing the FMC data offline, an azimuthal scan from 40° to 70°SW is generated that provides results similar to the standard PA process. With the same raw FMC data, another azimuthal scan from -10° to 10°LW is generated, which allows SDH located just under the search unit, that were not detected with standard PA, to be observed. This demonstrates that acquiring FMC data can significantly enhance phased array summation optimization and prevent costly re-scans.
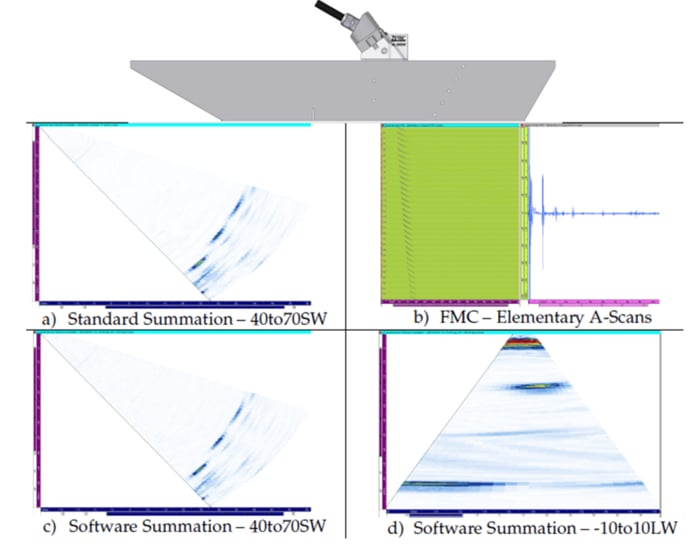
Figure 18: Example of FMC Data processing capabilities
Nowadays, we have developed a lot more methods to process FMC data sets, such as Total Focusing Methods (TFM) and Phase Coherence Imaging (PCI), but the work done using UltraVision more than 10 years ago was a stepping stone for all this development.
Applications Beyond Nuclear Power Generation
Benefiting not only the nuclear industry, these key features became directly applicable in applications in heavy manufacturing, aerospace, and oil & gas. For example, UltraVision software was deployed for the inspection of B787 carbon fiber reinforced plastic (CFRP) stringers and spars. The time reversal inspection technique is key for composite material part inspections, and increased speed and accuracy with scalable NDT solutions saw more opportunities for the oil and gas sector.
Time Reversal Inspection Technique for Complex Composite Parts
The time reversal technique, available as an option with Zetec standard PAUT hardware and driven by the UltraVision software, is a paradigm shift for inspecting composite structures. It compensates for probe misalignment and misorientation in real-time without slowing down the scanning speed and enhances flaw detection capability while improving porosity assessment. The time reversal solution also reduces the cost of required mechanical scanning systems, resulting in cost savings for the end customer. With the ability to connect multiple hardware units to a single PC and fire multiple probes in parallel, the time reversal technique has the potential to substantially increase scanning speed. It is clear that the UltraVision software-driven time reversal technique is a powerful tool for efficient and effective inspection of composite structures. You can learn more in this dedicated blog.
Corrosion Inspection Using NDT Paintbrush Scanner
In oil and gas, regulations for improving safety of people and environment caused an increase in the use of NDT for early detection of defects. This increase in demand for NDT combined with the uncertainty in the price of crude oil resulted in numerous providers looking to find innovative ways to conduct more efficient and accurate inspections. Key challenges existed including the inspection of different types of welds which can be complex and expensive to assess, or corrosion mapping which can be difficult and time consuming to complete on a full area of interest. Check out this blast-from-the-past webinar demonstrating the applicability of the NDT Paintbrush scanner powered by UltraVision software to handle a wide range of oil and gas applications including the inspection of boiler tubes, long seam welds, and corrosion mapping.
But this article is about reflecting on the past and looking to the future if we may carry on...
2021: Zetec Acquired by Eddyfi Technologies
Fast forward to 2021 where Zetec was acquired by Eddyfi Technologies. The commitment to continue to support and invest in UltraVision software remains the same. This is evident with innovative features available today, such as the implementation of an advanced focusing algorithm in UltraVision Touch and Classic with TOPAZ® 64 and Emerald, FMC data reconstruction algorithms, frequency filter tool, data compare, rule-based automation analysis, and advanced live total focusing method (TFM) and plane wave imaging (PWI) inspections using new Emerald phased array UT system.
.png?width=800&height=300&name=Topaz64%20%26%20Emerald-1%20(1).png)
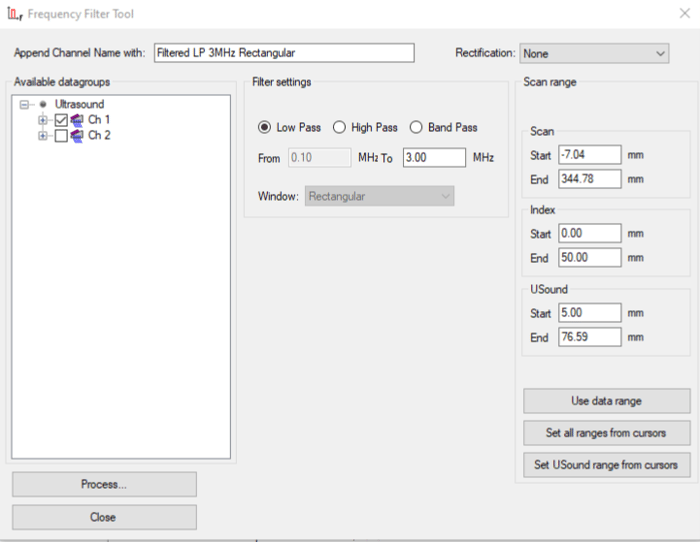
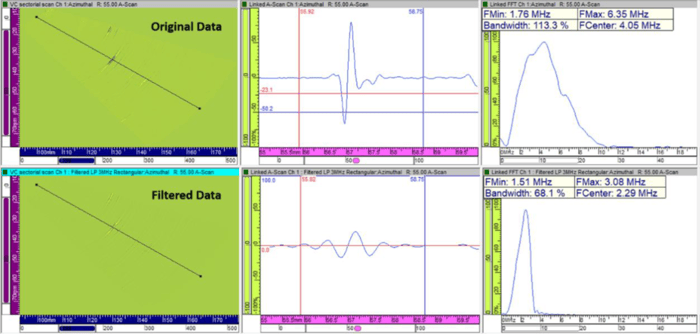
Frequency Filter Tool
The frequency filter tool is a feature within UltraVision software that allows for enhanced signal processing and filtering of ultrasonic data. By using this tool, inspectors can improve the detectability of flaws in materials, reduce inspection time, and improve the overall quality of inspection results. The tool is designed to be user-friendly and customizable, with various filtering options available to suit specific inspection needs.
Data Comparison
The Data Compare tool is intended to perform a subtraction between two sets of UVData and therefore highlight the differences between the two compared datasets. This application allows the user to compare an acquired dataset, which is currently under evaluation, with a reference dataset. The reference dataset could be either data from a reference state in time (e.g., before commissioning a component, after a certain service time, etc.) or from a reference integrity condition. The objective is to reduce the contribution of signals originating from the geometrical features and to obtain a highlight of “what is different” from the reference.
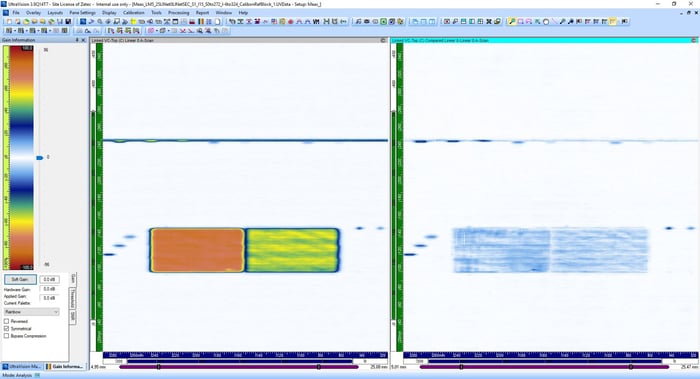
Figure 19: Data Comparison Tool
Rule-based Automated Analysis
The Automated Analysis feature is intended to perform data analysis on a .UVData file by applying different detection methods with various user-defined criteria for multiple types of indication. This feature allows the user to define a sequence of rules (kernels), with specific methods and parameters, which will be used in the data analysis process to detect/size indications in the selected area of interest and accordingly create indications in the indication table. This new feature classifies the created indications in the indication table according to the kernels used to detect/size them and it also provides the user with new tools to manage the indication table in a more optimized manner (filters, hide data, assigning indication box color based on classification). The objective of developing the Automated Analysis feature is to support the analysis sequencing (set of kernels) to detect, size, and classify different indications within a customizable area of interest in the data volume. The sizing algorithm is also improved for better performance with a -X dB drop from the maximum indication value in all axes.
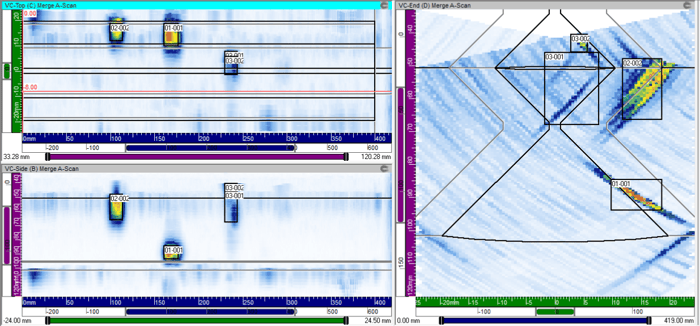
Figure 20: Rule-based Automation Analysis tool
Continued Innovation and Market Expansion: A Beyond Current Future
UltraVision has been essential NDT inspection software for over 25 years. Its development and upgrades have made it crucial in the nuclear power, heavy manufacturing, aerospace, and oil and gas industries. From its early days as TomoView, UltraVision has undergone numerous enhancements, with features like full matrix capture, time reversal inspection techniques, and advanced focusing algorithms. Its ability to read back and analyze legacy data files from the R/D Tech era has ensured efficient and reliable follow-up inspections of mission-critical components.
UltraVision has already reached new heights in the space sector, with a key application being the in-service inspection of layered pressure vessels (LPV). The software has also been widely used in other industries to detect and analyze flaws in materials, reduce inspection time, and improve overall inspection quality.
The future of UltraVision is exciting, with ongoing development of new features and applications. Eddyfi Technologies is known for its Beyond Current philosophy, which pushes the boundaries of NDT technology. This philosophy ensures that UltraVision will continue to be an innovative and reliable software solution in the years to come.
Investing in UltraVision today means investing in the future of non-destructive testing (NDT) inspection software. UltraVision's compatibility with other software in emerging markets and continuous development of new features and applications make it a smart investment for companies striving to stay ahead of the competition. By leveraging UltraVision's capabilities, companies can anticipate greater inspection efficiency, improved flaw detection, and enhanced inspection quality.
Stay in the NDT know for what UltraVision software will bring next by subscribing to our blog here and get in touch with our friendly team of experts for answers to your specific questions today!