
The particular design and fabrication of these multi-layered pressure vessels (MLPV) requiring fitness-for-service assessments presented a challenge for inspecting the shell-to-shell layers. Access was an issue here as most vessels only have small nozzles on each end, restricting personnel access for entry. Vessels in service at NASA require maintenance of cleanliness, so opening a pressure vessel to atmosphere was not a viable option, especially considering the additional costs to do so. Fortunately, advances in non-destructive evaluation have seen phased array ultrasonic testing become the trusted technology for volumetric examinations.
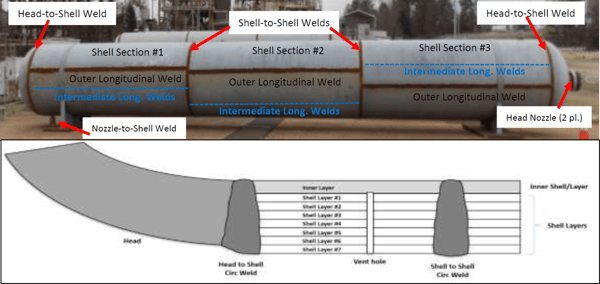
Figure 1 Typical Layered Pressure Vessel (LPV) and schematic representation
However, shell-to-shell welds present specific challenges for volumetric examination while using PAUT methods. In this case the weld is up to 100 millimeters (4 inches) thick, and both axial and circumferential flaws must be looked for with reliable detection and accurate sizing techniques. These welding defects can be surface breaking on both the inside and outside diameters, but also embedded like lack of fusion (LoF) between the weld and vessel layer. Because the layers on both sides are only fused at the weld, air is present in between the layers which creates ultrasound reflections on the bottom of the first layer. Therefore, the acoustic beams can only enter the volume from the weld top which is quite an unusual configuration that offers limited options.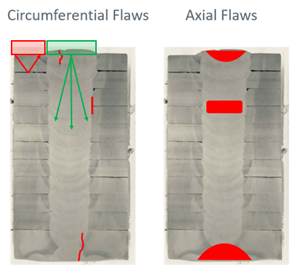
Figure 2 Potential Flaws in LPV Weld
Challenge accepted.
In order to prepare for the shell-to-shell weld inspection, they need to be made smooth in a flat topping procedure that lends itself well to coupling the PAUT search units for inspection.
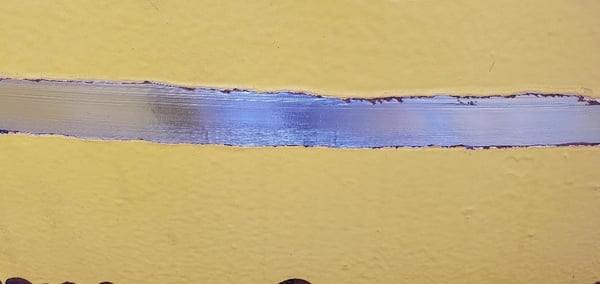
Figure 3 Shell-to-Shell Weld Preparation
Inspection Technique
In this specific use case, we identified the different probes required to achieve the desired results by considering the several depth ranges of the thickness of the pressure vessel.
Outside Diameter Circumferential Flaws
For the zone near the Outside Diameter (OD) surface, from 0 to 15.24 mm (0.6 in) deep, we selected a small 2D matrix array probe at 5 MHz, with 9 x 7 elements, mounted on a shear wave wedge. As shown below, the probe assembly is located on the weld, and a sector scan from 40 to 80 Shear Waves (SW) is used to cover the bevel and part of the weld volume. With this inspection technique, the benefit of the 2D matrix array lies in its capability to focus in the perpendicular plane as well as in the incidence plane, thus providing better sensitivity and lateral resolution of the acoustic beam. Two probe orientations perpendicular to the Weld Center Line (WCL) are required to cover the complete examination volume, in combination with a mechanical single line parallel to the WCL with a resolution of 1 mm (0.04 in).
Intermediate Range and Inside Diameter Circumferential Flaws
To address the intermediate and Inside Diameter (ID) surface zones from 15.24 mm (0.6 in) to full thickness, we designed a custom large 2D matrix array probe at 5 MHz with 18 x 14 elements. The probe assembly is located on the weld with two different focal law groups generated to cover the ID root zone and the intermediate bevel zone. Again, 2D matrix array technology is used to optimize focusing for better sensitivity and lateral resolution of the inspection. Because we are forced to use low inspection angles for the ID root zone, no corner trap responses could be expected for ID connected planar flaws; therefore, the inspection technique relies entirely on tip signals. Two probe orientations perpendicular to the WCL are required to cover the complete examination volume in combination with a mechanical single line scan parallel to the weld.
Axial Flaws
When looking for axial flaws, we divided the thickness of the vessel into three depth ranges again and created a dedicated focal law group to cover each. We use the same large 2D matrix array probe at 5 MHz with 18 x 14 elements but we are able to use shear waves given the weld geometry. For this inspection technique, we use the 2D matrix arrays to simultaneously steer and skew the acoustic beam as demonstrated below.
For the zone near the OD surface, 70 SW beams are produced with skew angles from -15 to +15 degrees to cover the complete weld volume and the bevel. Similar focal law groups at 60 SW and 40 SW are made to cover the intermediate and the ID surface range. Two probe orientations parallel to the WCL are used, clockwise and counterclockwise, combined with a mechanical single line scan parallel to the WCL, with a resolution 1 mm (0.04 in).
Hardware and Software
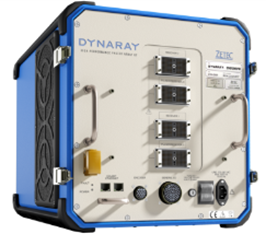
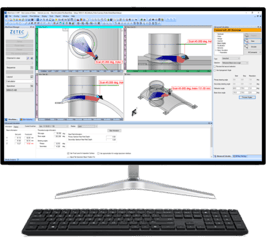
To deploy these inspection techniques with measurable results efficiently, a high-performance PAUT system and software are required. The DYNARAY® system with 256 beamforming channels is necessary to drive the large 2D matrix array probe with a high data throughput.
The system is controlled by the UltraVision® Classic software. This complete inspection package manages all phases of the inspection process in a full 3D environment from developing and validating probes and inspection techniques to setup, calibration, data acquisition, and finally, offline data analysis, evaluation, and reporting. The UltraVision software is capable of handling data files larger than 20 Gigabytes.
System Validation
The experimental validation of the considered inspection techniques was conducted on a demonstration specimen —weighing nearly 2,000 pounds— containing two welds representative of shell-to-shell welds in layered pressure vessels. A commercially available motorized scanner was used for all data recording, seen below.
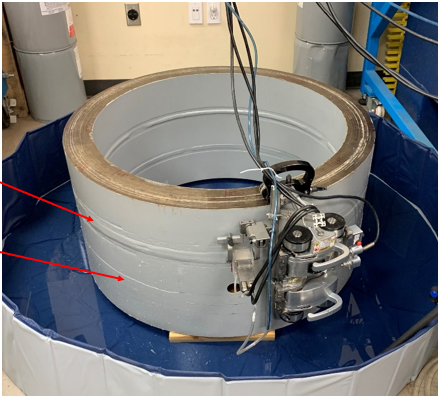
Figure 4 Inspection Setup in Quebec Applications Lab
One weld was examined as an “open” trial, meaning that the data analyst had prior detailed knowledge of the number, position, and size of the flaws present in the weld. This part of the exercise was used to validate and quantify the individual inspection techniques' performance and optimize the data analysis process.
The second weld was examined as a “blind” trial, meaning that the data analyst had no prior knowledge about the flaws. This part of the exercise was used to validate the performance further and demonstrate the robustness of the data analysis process in a realistic situation. This exercise also allowed us to validate the reliability and efficiency of the data acquisition process and provide an accurate estimation of the inspection speed.
Inspection Efficiency
Before sharing the results, it is important to highlight the efficiency of the data acquisition process.
-
The inspection for circumferential flaws requires four single line scanning sequences with a maximum scanning speed of 30.48 mm(1.2 in) per second [scan res. = 1 mm (0.04 in)].
-
The inspection for axial flaws requires only two single line scanning sequences with a maximum scanning speed of is 15.24 mm (0.6 in) per second [scan res. = 1 mm (0.04 in)].
Therefore, the total effective scanning time to collect all raw inspection data on a 914-mm (36-in) diameter weld is less than 20 minutes, not including the scanner manipulation, probe exchange, and calibrations.
Our data analysis process uses merged data groups for most operations to optimize efficiency. All merged groups are created with a single command for each data file, and before starting the actual evaluation, the data is checked for correct essential parameters, adequate coupling, and missing data.
This first example is a planar axial flaw, OD connected, and we selected the data from the 70 SW group focused on the near surface zone. Looking at the projected top, side, and end views zoomed in on the defect region, we can see that the flaw is detected with a remarkably high signal-to-noise ratio (SNR) and accurately positioned in the weld geometry. The 14 dB amplitude drop technique is used to determine the flaw length. It is applied using the echodynamic curve in the end view. In the side view, we can observe resolved signals from the corner and the tip of the flaw, allowing for accurate depth sizing.
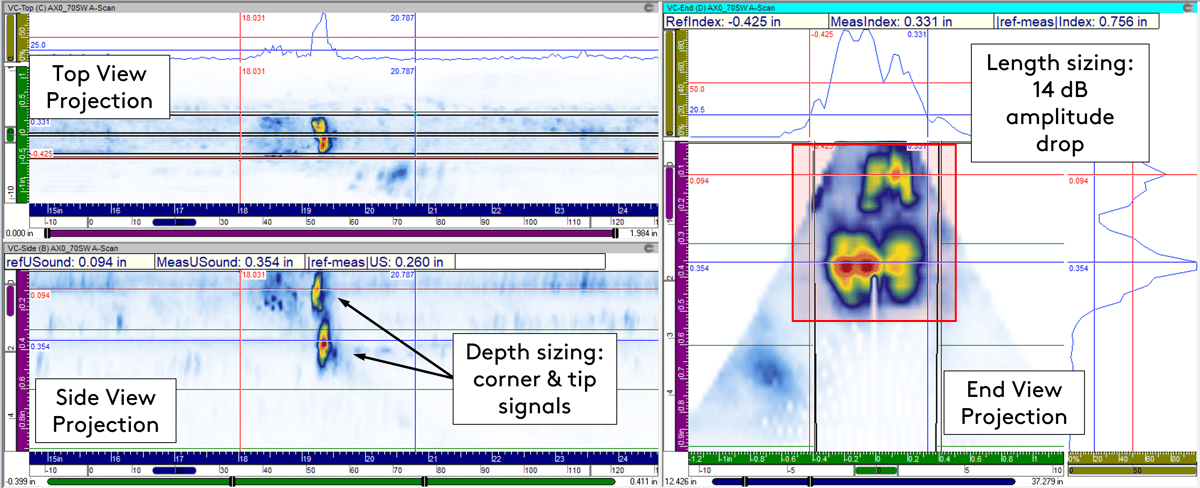
Figure 5 Axial Flaw, Planar, OD Connected – Merge AX0_70SW
The second example is again a planar axial flaw, but ID connected. To find and characterize this flaw, we selected the data from 40 SW group for axial flaw detection and observed that the flaw is again detected with a very high SNR on the three views. The 14 dB amplitude drop technique allows for determining the flaw length. And in both the side view and the end view, we can resolve signals from the corner and the tip of the flaw, thus allowing for accurate depth sizing.
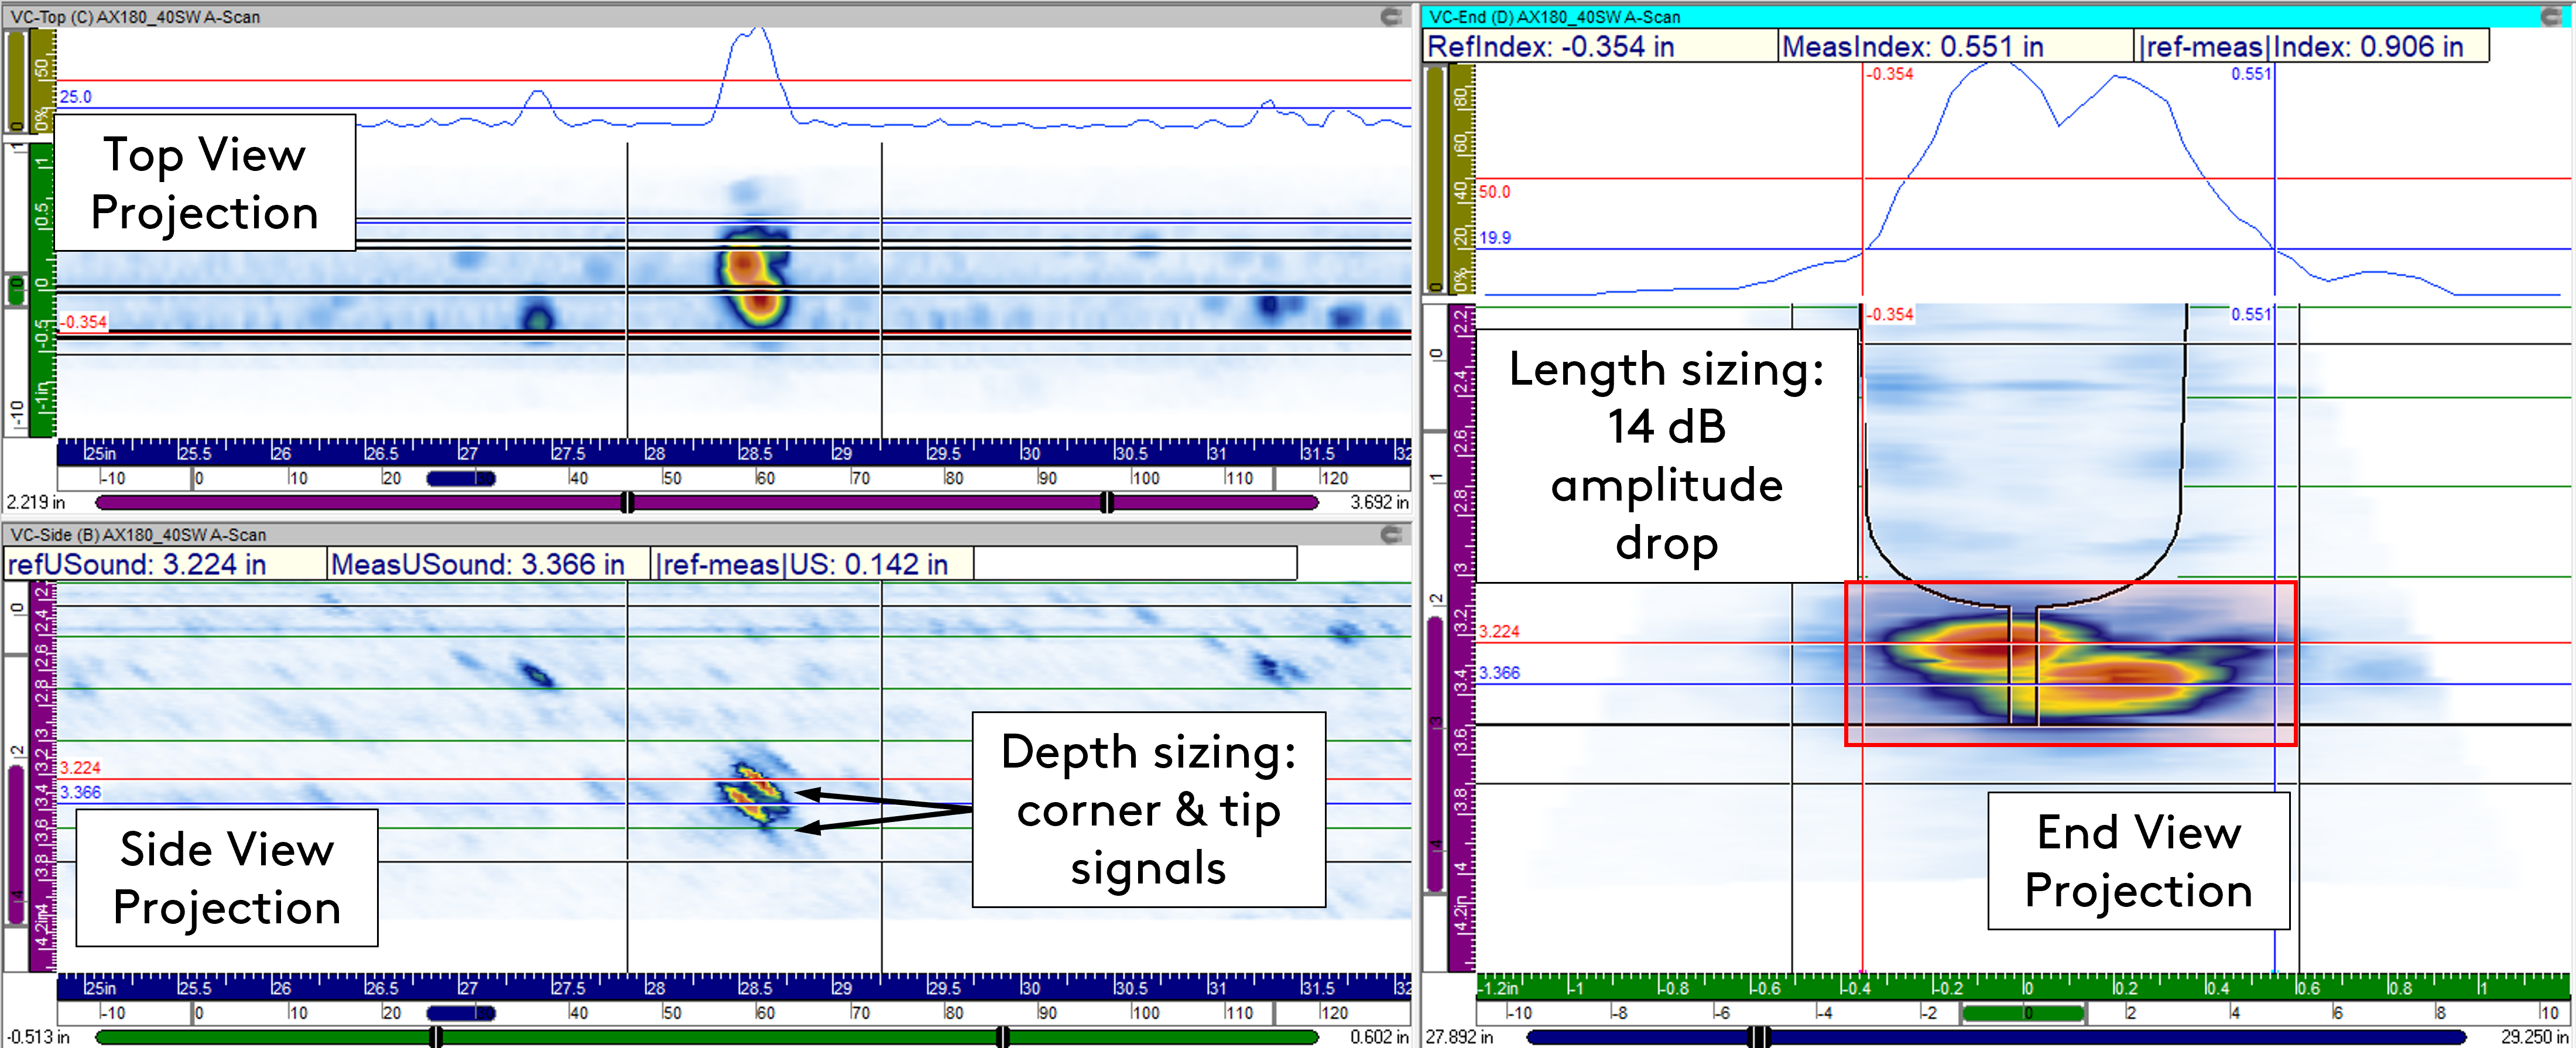
Figure 6 Axial Flaw, Planar, ID Connected – Merge AX180_40 SW
We also detected the planar ID connected circumferential defects by using the examination data of the dedicated inspection techniques presented earlier. This is a good example. On the side view, we see an indication with a substantial extent along the scan axis. By using the projection, gates can be discriminated from the geometric echoes coming from the layers. The 14 dB amplitude drop technique is used for length sizing, and the tip and back-wall signals for accurate depth sizing.
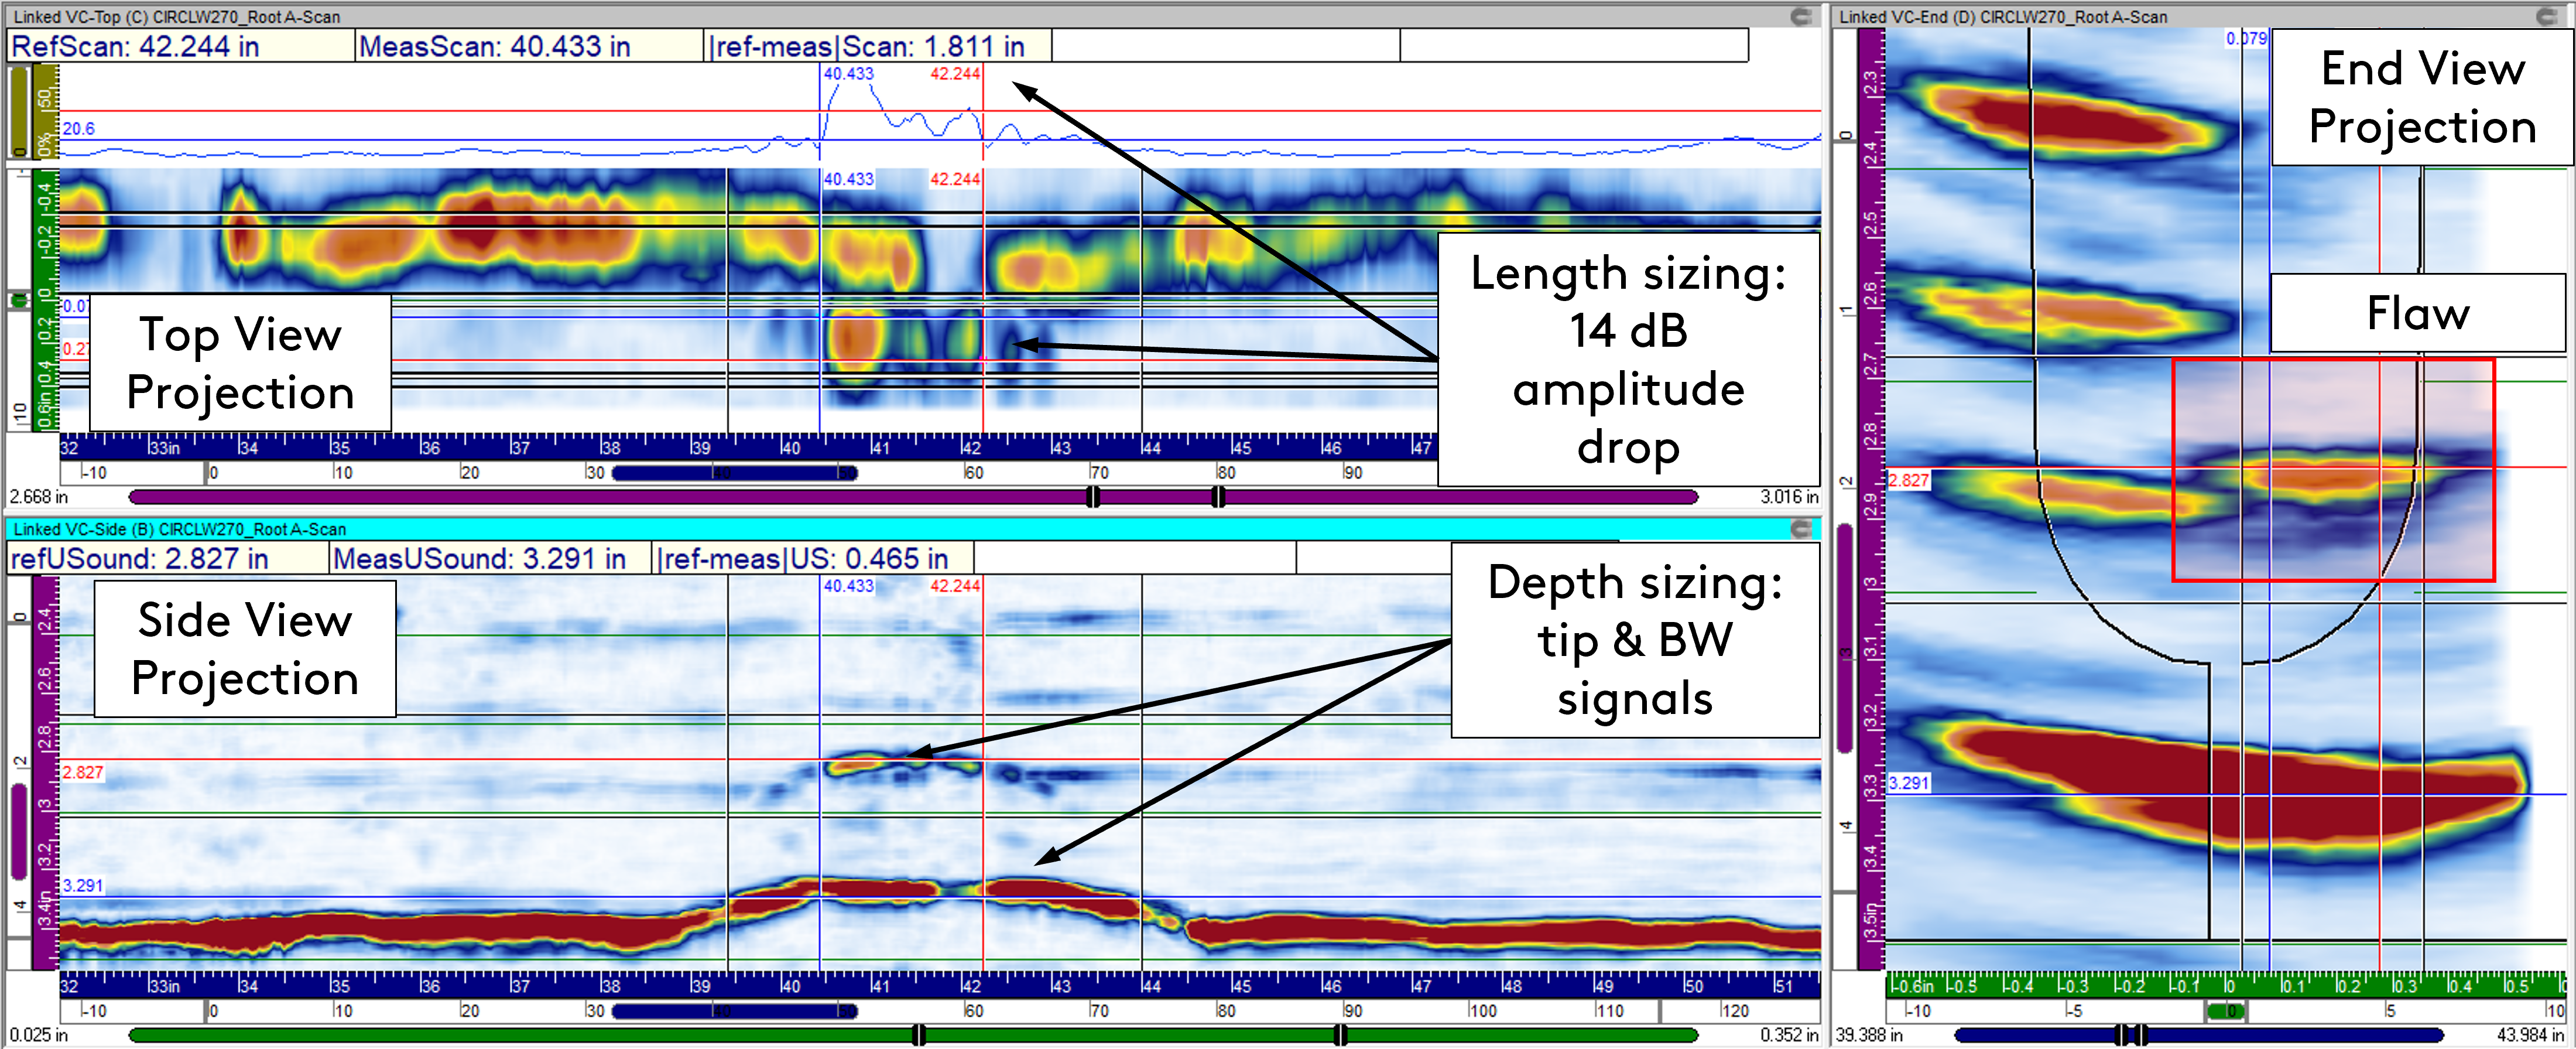
Figure 7 Circ. Flaw, Planar, ID Connected – Merge CIRCLW270_Root
Validation Exercise Results Summary
All of the intended flaws, axial and circumferential, ID and OD surface connected and embedded, were reliably detected and characterized. Moreover, no "false" positives were reported. The exercise shows that length sizing using the 14 dB amplitude drop technique provides accurate and conservative results. The RMS (root-mean-square) error is below 3.81 mm (0.15 in), and no flaw lengths were undersized. The through-wall sizing process also provided highly accurate results; in fact, the RMS error is roughly 1 mm (0.04 in).
To put this in perspective, we can say that the RMS error for both length and through-wall sizing is well below the sizing tolerance used by EPRI PDI for ASME XI, App. VIII qualifications on critical piping welds in nuclear power plants.
Finally, the length and depth sizing results from "open" and "blind" welds were similar, proving the sizing process's robustness.
Conclusion
The custom developed 2D matrix array probe and inspection techniques offer excellent inspection performance on a demonstration specimen representative for shell-to-shell welds in LPV. All intended flaws in the two welds of the demonstration specimen were reliably detected and characterized. The proposed length and through-wall sizing procedures provided accurate results during both "open" and "blind" trials. DYNARAY and UltraVision successfully deliver the Eddyfi Technologies advantage to NASA. In fact, they published an article on the same here.
How can we help you? Eddyfi Technologies has a range of phased array technology and so much more to keep users Beyond Current. Contact our team of experts to discuss your next inspection.