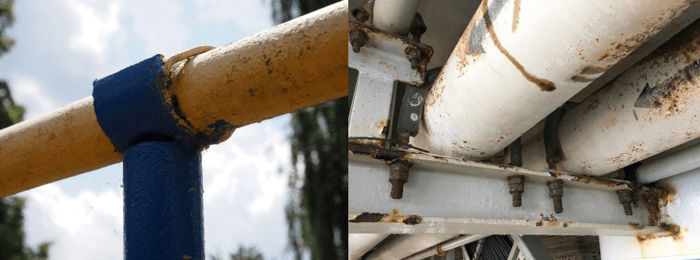
Many pipe support designs such as resting or mechanically fastened supports allow water to collect between the support and the pipe surface, and thus create an ideal environment for crevice corrosion. In some cases, galvanic corrosion can also be a cause for concern. Even though both the support and pipe material are steel, there may still be a small enough potential difference to generate a corrosion cell. Welded supports offer a solution to this problem; however, construction and future inspection costs may make this option undesirable. Identifying corrosion at support locations is difficult as the support itself commonly conceals the pipe surface in the region of concern as shown in Figure 1.

Guided wave inspection is a rapid method of identifying CUPS. Guided wave testing is sensitive to changes in the cross-section of the pipe. Therefore, it can detect regions of wall loss corrosion that cannot be verified by visual methods. Guided wave testing scans large sections of pipe from a single tool location. A benefit of having a sizeable diagnostic length is the ability to examine multiple signals from standard pipe features such as girth welds and pipe supports. Having access to several signals of the same feature allows their inspection by a method of comparison (MOC). Pipe supports of a similar style typically exhibit similar signal amplitudes. Knowledge of this enables an inspector to scrutinize these features, comparing them to identify rogue signals.

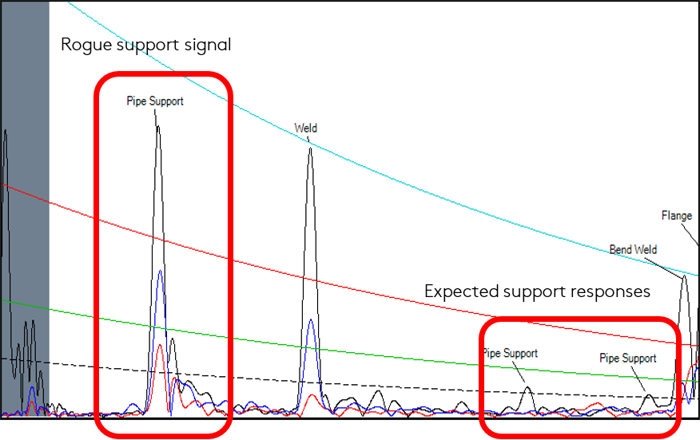
The A-scan in Figure 2 illustrates a typical scenario in which a rogue support signal has been identified. In this case, the signal from the support has a much higher amplitude (~12dB) than the other two support signals seen in this scan. In this scenario, the support signal would only offer a low amplitude response as the pipe is resting on the support and is without any welded or mechanical connection.
In this case, it is easy to see why this support has been identified as having a rogue response when compared to the other two support responses. The MOC becomes even more reliable when comparing signals across multiple scans.
The MOC should be employed, particularly in situations where the pipeline has a history of CUPS, or where there is a high likelihood of CUPS due to support style and the external environment.
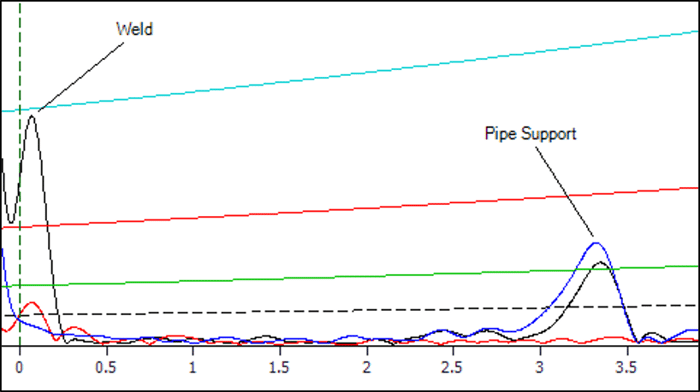
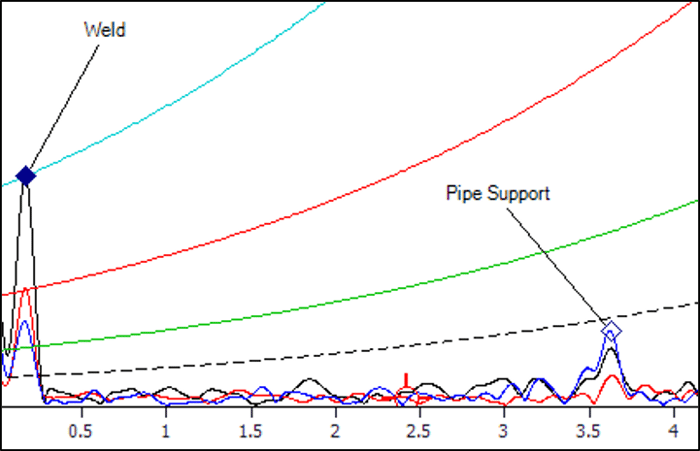
The responses can be scrutinized even further by examining these signals across the collected frequency range. The signal response from simple supports typically exhibits larger amplitudes at lower frequencies. As such, identifying CUPS may be more difficult as the signal from the support itself may obscure any signals from wall loss corrosion. Responses from simple supports typically reduce at higher frequencies. A lower amplitude response from the support simplifies the process of detecting CUPS as a smaller response is less likely to obscure a response from wall loss corrosion. Figures 3 and 4 show the same pipe support response at both 36kHz and 72kHz frequencies. The signal from the pipe support has a definite drop in amplitude (~6dB) on the 72kHz scan giving credence that higher frequency scans can be useful in detecting CUPS.


This is just one example of where the Sonyks is a great candidate for detecting defects left otherwise unknown. Contact our NDT experts to discuss your specific inspection requirements today!


