HDPE ultrasonic inspection is challenging because the material strongly attenuates ultrasound and does not support shear-wave propagation in practice, which limits inspection range and pushes techniques toward low-frequency longitudinal-wave approaches. In this article we compare TOFD, PAUT, and TFM for HDPE butt-fusion welds using 17 mm and 35 mm samples with representative defects, and we show why acquisition strategy (wedge choice, aperture, and energy) is critical.
For code compliance, ASME Section V Article 4 (mandatory Appendix X for HDPE fusion joints) requires examination coverage that includes the fusion face ± 8 mm on each side, which directly impacts scan plan and probe positioning.
Key takeaway: use TOFD for volumetric coverage when PCS and dead zones are controlled, use PAUT with the right coupling strategy (water wedge, Rexolite, or no wedge) to maximize SNR and coverage, and use TFM with Plane Wave Imaging (PWI) when you need more energy, better SNR, and higher scanning speed than FMC/TFM can deliver in thick, attenuative HDPE.
What Makes HDPE Ultrasonic Inspection Different?
HDPE differs from steel because ultrasound is highly attenuated and the practical inspection window is dominated by low-frequency longitudinal waves. Typical longitudinal velocity is about 2150–2500 m/s, close to Rexolite, which makes high-angle beam generation difficult and increases the importance of wedge selection and scan geometry.
Why HDPE Is Hard to Inspect
High attenuation shifts frequency content downward and reduces effective range, so sensitivity depends heavily on transmitted energy, short sound paths, and acquisition mode. This is why multi-element emission (for example PWI) and coupling strategy (water wedge vs Rexolite vs direct contact) can change detectability and SNR significantly in HDPE weld assessments.
Improvement in Productivity
Code Requirement (What Must Be Covered)
ASME Section V Article 4 (mandatory Appendix X for HDPE fusion joints) requires that the examination coverage include the fusion face ± 8 mm (0.3 in) on each side. Treat this as the primary constraint when you build your scan plan, because it drives probe positioning, beam angles, and the need to inspect from both sides in some configurations.
What This Article Tests (So Results Are Interpretable)
Two butt-weld samples are used (17 mm and 35 mm) with representative defects (crack/root features, flat-bottom hole, side-drilled holes, notch). Use the results below as comparative examples under these conditions, then qualify your own procedure on representative mockups.
Several ultrasonic methods were investigated to evaluate their sensitivity to detect defects: Time-of-Flight Diffraction (TOFD), Phased Array Ultrasonic Testing (PAUT), and Total Focusing Method (TFM). In ASME Section V Article 4, the ultrasonic examination of fusion joints of HDPE pipes is described in the mandatory Appendix X for all ultrasonic techniques. The code asks that for all classical parameters related to calibration checks, sensitivity settings, sizing method, and scan plan, the examination coverage should include the fusion face ± 8 millimeters (0.3 inches) on each side.
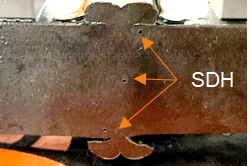
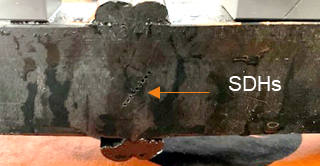
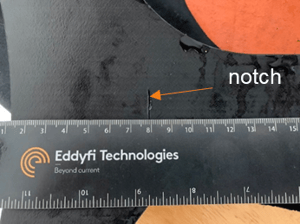
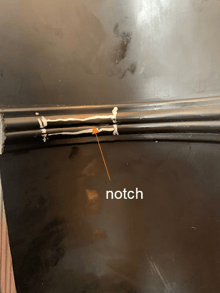
To illustrate the capabilities of each method, we used two samples: 17- and 35-millimeter (0.7- and 1.4-inch) butt welds containing several defects. The 17-mm sample contains a crack between the two beads along the root and a 3-mm (0.1-in) flat-bottomed hole. The 35-mm (1.4-in) sample contains three 1-mm side-drilled holes (SDH) on one side, and a set of nine SDH close to each other with a 4-mm notch along the backwall on the other side. Some of these defects are shown in the following images.
Time-of-Flight-Diffraction (TOFD)
TOFD Scan Plan Essentials (HDPE)
For HDPE, TOFD performance depends on (1) PCS selection to place the intersection point in the target zone, (2) managing dead zones that can hide SDHs or near-surface indications, and (3) accepting that shear-wave behavior is not reliable in these samples (no mode-converted backwall observed).
Practical validation rule:
Verify PCS using lateral wave and/or backwall timing, then confirm that your dead zones do not overlap the fusion face coverage required by code.
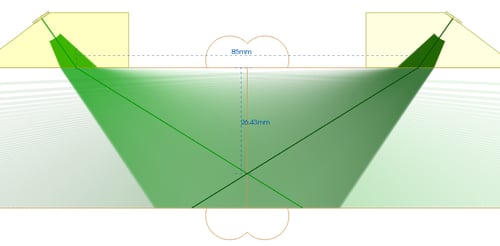
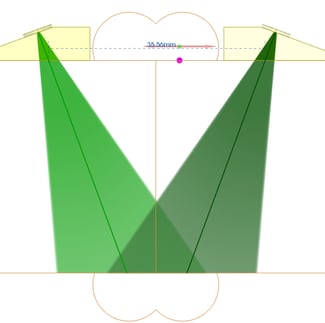
It has been documented that the TOFD technique can detect defects in HDPE material. To fully inspect the volume of the 35-mm (1.4-in) butt weld, we used a combination of two TOFD configurations. The first one uses a pair of 2 MHz probes with a diameter of 5 mm (0.2 in); the wedges are made of a low velocity material close to that of water. This allows the generation of 60° refracted waves. The Probe Center Space (PCS) is 85 mm (3.3 in) to create an intersection point at two-thirds of the thickness; it is verified by using the arrival time of the lateral wave and/or backwall echo. The second pair uses traditional L70 Rexolite wedges. The beams cross relatively deep with a very shallow angle.
The frequency of the lateral wave and backwall echoes were measured using a Fast Fourier Transform (FFT) estimated to be between 1 and 0.7 MHz with 85% and 100% bandwidth at –6 dB, respectively. No mode converted backwall is detected confirming that shear waves cannot propagate in these samples. The lower frequency content also leads to more divergence of the beam in both the active and passive plane. The scan plans are showed in the following figures.
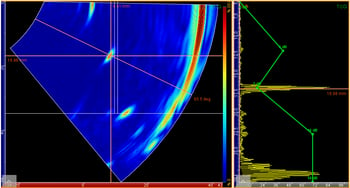
The following figures show the results obtained with both configurations with no pre-amplification or filtering used. The noise measured for each configuration is below 10% as requested by ASME Section V, Article 4. Signal-to-Noise Ratio (SNR) is measured above 20 dB for all defects. In the first figure obtained with L60 low velocity wedges, we can see on the left of the mechanical scan that only the middle SDH is detected; the top and bottom SDHs are in dead zones. In HDPE TOFD, coverage is not just “thickness covered”; it is “acceptance-zone covered.” Always map dead zones against the fusion-face ± 8 mm requirement and add a second configuration if needed. On the right side, multiple echoes are detected for the group of nine SDHs, although it is not possible to distinguish them individually. The wavelength is bigger than the distance between the SDHs.

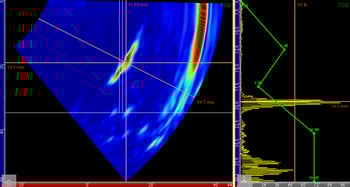
The bottom SDH on the left and the notch are detected and sized using the L70 Rexolite configuration.

Phased Array Ultrasonic Testing (PAUT)
What Matters Most in HDPE PAUT
In HDPE, coupling strategy and transmitted energy dominate sensitivity. The same probe can behave very differently depending on wedge material (water wedge vs Rexolite) or direct contact, because beam angles and coverage are constrained by HDPE velocity and attenuation.
All PAUT results were obtained with a 64L2.25-G3 probe, i.e., a 2.25-MHZ, 64-element probe with a 0.6 mm (0.02 inch) pitch and 10 mm (0.4 inch) elevation. We evaluated the sensitivity of detection using various wedges: a soft wedge composed of a rubber membrane filled with water, a typical shear 55° Rexolite wedge, and we also tested the probe in direct contact with the HDPE pipes. For each configuration, a Time Corrected Gain (TCG) is applied to compensate for the sensitivity at various depths.
Water Wedge
Best for: adaptable coupling on various pipe diameters and strong detectability on small reflectors when focusing along the fusion face with full aperture.
Watch-out: document wedge delay calibration and focusing strategy because they drive angle, height, and repeatability.
The following figures show the results obtained with the water wedge. The water wedge conforms well to various pipe diameters. The wedge delay calibration is performed to extract the angle and height of the wedge. The delay law is a projection that focuses on the fusion face using the full 64-element aperture. All the 1-mm (0.4-inch) SDHs are detected with a strong SNR of 25 dB. The frequency of the bottom SDH is measured at 1.5 MHz with a bandwidth of 40%. Like the TOFD results, PAUT is not able to distinguish the nine SDHs close to each other due to a 1.6-mm (0.06-in) wavelength. The wedge echo is seen afterwards, past the 8 mm (0.3 in) of the required volume examination.
Rexolite Wedge
Best for: stable geometry modeling when Rexolite velocity is close to HDPE and you want repeatable ray tracing against the fusion face.
Key limitation: high angles can hit the front of the wedge, and full fusion-face ± 8 mm coverage on the opposite side may require inspection from the other side.
We then used a SW55 Rexolite wedge comparing 32- to 64-element apertures. Due to the identical velocity between Rexolite and HDPE, the refracted angle is 36° for L-waves. Just like the water wedge, we focus the energy along the fusion face. A 2D CAD file of the HDPE pipe is imported to see the weld beads at the cap and root.
Ray tracing shows that the high angles hit the front of the wedge. It is thus difficult to inspect the top part of the fusion face including the 8 mm (0.3 inch) located on the opposite side; an inspection from the other side would be required to obtain full coverage. The sectorial scans for both the 32- and 64-element apertures show a clear detection of the three SDHs.
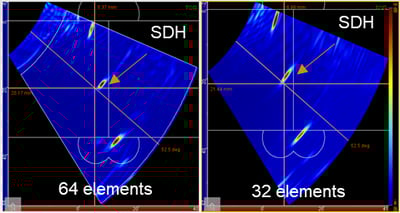
The inspection of the notch with the two configurations show that the 64-element aperture provides a better spatial resolution and SNR (24 dB vs 16 dB). There is also a better distinction between the corner echo and tip diffraction due to the smaller beam spot. The 64-element aperture would be greatly beneficial for thicker pipes.

The same configuration was applied to the 17-mm (0.7-in) sample. The following images show the results obtained for the FBH and the crack detected with a 16 and 24dB SNR, respectively. The combination of the CAD import and 3D export tool available with Capture™ software shows the two defects in the 3D representation of the geometry.


No Wedge
Best for: eliminating wedge echoes and improving coverage at normal incidence when your code-required volume is not compromised by surface echo location.
Why it behaves differently: attenuation shifts frequency content lower, so pitch becomes small relative to wavelength and grating lobes are not generated in this configuration.
Finally, we used the probe directly on the pipe. The front face of the transducer is adapted for Rexolite and thus adapted for HDPE as well. We can see a strong surface echo, but it is outside of the 8 mm (0.3 in) examination coverage required by the codes. This configuration allows detection of all the defects without any wedge echoes. Despite being at normal incidence, the no-wedge configuration allows detection of the top SDH. The high attenuation leads to lower frequency content; the pitch of the probe becomes quite small compared to the wavelength. The configuration thus does not generate any grating lobes.

Total Focusing Method (TFM)
Definition: Why TFM Is Different In HDPE
TFM reconstructs a focused image from captured data, but in HDPE the limiting factor is often transmitted energy, not reconstruction math. If single-element FMC excitation is too weak for thick, attenuative sections, acquisition mode must change to increase energy while keeping TFM reconstruction quality.
We then evaluated the TFM method for inspecting the HDPE samples. When performing FMC/TFM, we fire each element individually. While the reconstruction process uses the full 64 elements, the excitation of only one element may not be enough while inspecting thick and attenuative materials. Eddyfi Technologies developed a new TFM process called Plane Wave Imaging (PWI). Instead of firing the element one by one, the system performs a sectorial scan with few angles for the emission and TFM for reconstruction. Firing all the elements at the same time sends more energy into the part leading to better sensitivity.
We used PWI with a 35 to 85° sectorial scan and a step of 3° to inspect the 35-mm (1.4-in) HDPE sample. Results are presented with the gain used and scanning speed achieved.


Evidence From This Setup (Why PWI Helps In Thick HDPE)
- Lower gain required: PWI required 17 dB less gain than FMC/TFM in this setup.
- Higher SNR on tip diffraction: the SNR measured for the tip diffraction is reported as 13 dB with FMC/TFM versus 28 dB with PWI.
- Higher productivity: scanning speed is reported as improved by a factor greater than three times.
- Tuning lever: overall energy and sensitivity depend on the number of emission angles used, so you can increase angles if SNR is marginal.
When to Use Additional TFM Paths (Odd Modes) In HDPE
Most butt-fusion weld flaws are vertical along the fusion face, so include at least one odd-mode path when available because it can improve sensitivity to vertical indications compared to direct-only imaging.
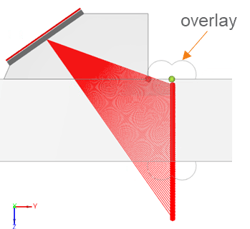
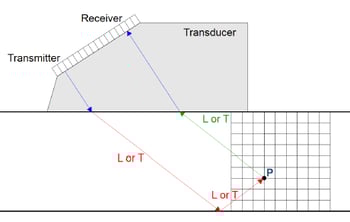
Most defects for HDPE butt welds are vertical along the fusion face. One of the advantages of TFM is the possibility of detecting defects through a multiplicity of paths or modes. Odd modes, meaning modes that have an odd number of paths, are good for the detection of vertical indications. One of these modes, the LLL, is carried out when the ultrasound propagates inside the part with a direct longitudinal wave, reflecting off the backwall, reaching each pixel of the TFM area, and returning to the probe all while keeping the longitudinal wave type. Since shear waves don’t propagate, there is no potential mode conversion after reflection off the backwall. The following figures explain an indirect odd mode.
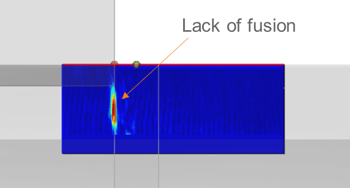
The following results were acquired in an area without a defect (top) and with a lack of fusion (bottom). In the results without a defect, there is a weak vertical observed which is the diffraction due to the weld bead along the root. In an area with a defect, a vertical echo is clearly seen in the TFM image and in the D- and C-scan images. The LLL mode can be complementary to the direct mode.


When to Use TOFD vs PAUT vs TFM/PWI for HDPE Welds (Quick Decision)
| Goal / constraint | Start with | Why | Watch-out |
|---|---|---|---|
| Meet code coverage at fusion face ± 8 mm | PAUT (choose coupling strategy) | Best control of fusion-face targeting with focusing | May require scanning from both sides with some wedges |
| Volumetric coverage + sizing cues (when configured correctly) | TOFD (possibly multi-zone) | Detects and sizes many indications when PCS/dead zones are controlled | Dead zones can hide reflectors; validate against acceptance zone |
| Thick, highly attenuative HDPE where FMC energy is insufficient | TFM with PWI | Multi-element emission increases energy, improves SNR and speed | Tune angle count to recover SNR |
Practical Checklist: Qualifying an HDPE UT Procedure
- Confirm code-required coverage: fusion face ± 8 mm on each side is explicitly covered in the scan plan.
- Use the shortest practical sound path because attenuation limits range in HDPE.
- For TOFD, set PCS to place intersection in the target zone and map dead zones against the acceptance zone.
- For PAUT, choose coupling strategy (water wedge, Rexolite, or no wedge) based on coverage and wedge echo constraints, then document the delay calibration and focusing approach.
- Validate that defect separation is physically achievable (wavelength vs defect spacing), since closely spaced reflectors may merge.
- If using TFM, prefer PWI in thick HDPE when FMC excitation is insufficient; tune angle count to meet SNR needs and document the set.
- Qualify on representative mockups (thickness, geometry, defect types) and record SNR/noise criteria used during qualification.
While HDPE presents several challenges for ultrasonic inspection, Cypher® instrument coupled provides all the tools necessary for easy and sensitive inspections starting with improved TOFD channels and the 64-element aperture for PAUT and PWI for TFM.
Put our advanced inspection solutions to the test! Contact our NDT experts to discuss your challenging pipeline assessments and stay Beyond Current.