
Pulsed eddy current is a widely accepted inspection method now covered by several industry standards such as ISO: 20669, API RP 583, and the new ASME Boiler and Pressure Vessel Code Section V. PEC is a versatile inspection technology which provides an average remaining wall thickness through insulation and coatings. The technique can also be used to safely assess the minimum remaining ligament under corrosion scabs or blisters without surface preparation. However, the technology remains cross-sensitive to wall loss and changes in electromagnetic properties or the presence of interfering components. The algorithms used to size wall thicknesses assume that variations in the eddy current decay are a function only of the wall thicknesses and that the other material properties are constant. This limitation renders analysis difficult on more complex geometries and can lead to false positives in some cases.
Figure 1 summarizes the three major factors required by analysts to make accurate calls and prevent those false positives: 1) look at the C-scan to find areas of interest while considering the varying baseline and noise level, 2) look at the signals from datapoints in the areas of interest, and 3) use the context to evaluate its influence on the C-scan and signals to make an informed call. It is thus essential to gather all the information available on the component including, but not limited to, as-built drawings, corrosion mechanisms, and morphology.
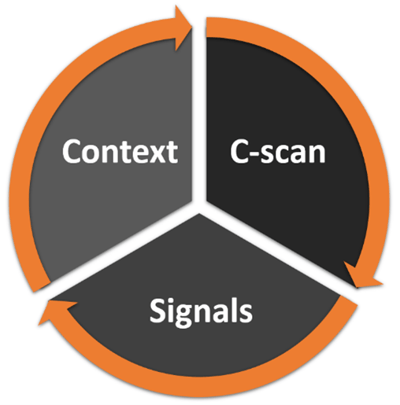 Figure 1: Requirements for Post-Processing Analysis
One of the key points to assess an indication is the ability to look at the signal shape of datapoints in areas of interest to determine whether they correspond to a true wall loss or a false positive. The A-scan provides crucial information to analysts that help them achieve this assessment. This includes the amplitude variation as a function of time, the initial signal amplitude, and the eddy current decay rate. On one hand, for a true wall loss indication, the signal amplitude is fairly constant in the area of interest, and a faster decay correlates with a thinner thickness. On the other hand, a false positive is typically associated to an indication with a lower wall thickness measurement combined with a stronger signal amplitude and a steeper slope early in time. In this situation, the A-scan goes above the calibration in the beginning and drops significantly at the end as shown in Figure 2. This is also characterized by an A-scan crossing the calibration line.
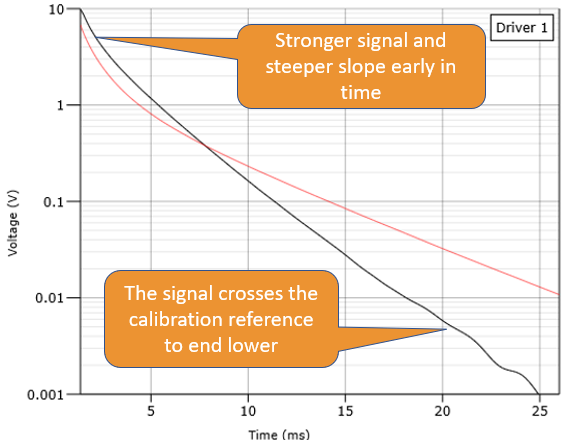 Figure 2: Effects of Variations in Material Properties on A-scan
The innovative graphical data analysis PermTool was hence designed and introduced in Lyft CPN software to highlight the relationship between the local wall thickness variation and its corresponding signal amplitude. With this unique tool, Lyft CPN is the only PEC software on the market able to graphically discriminate true wall loss from false positive indication.
To better highlight the relationship between wall thickness and signal amplitude variations on an indication, several datapoints in a single axis (X or Y axis) are used by the PermTool. This relation is then graphically expressed by using a trace and a vector. The trace is formed by connecting all the selected datapoints together and is used to assess the quality of the data. On the other hand, the direction of the vector is essentially a function of the highest wall loss datapoint selected. Based on all this information, the trace and the vector will point in one of the four different regions of the PermTool, as illustrated in Figure 3. The four areas determined through an exhaustive campaign of data analysis are: 1) True wall loss, 2) False positive, 3) Uncertain, and 4) Undefined. A threshold on the local wall loss can also be displayed by the PEC inspector if required. More details on the tool and a complete definition of these four areas can be found here.
Hence, not only is the PermTool able to assess the nature of an indication, but it’s also easy to interpret!
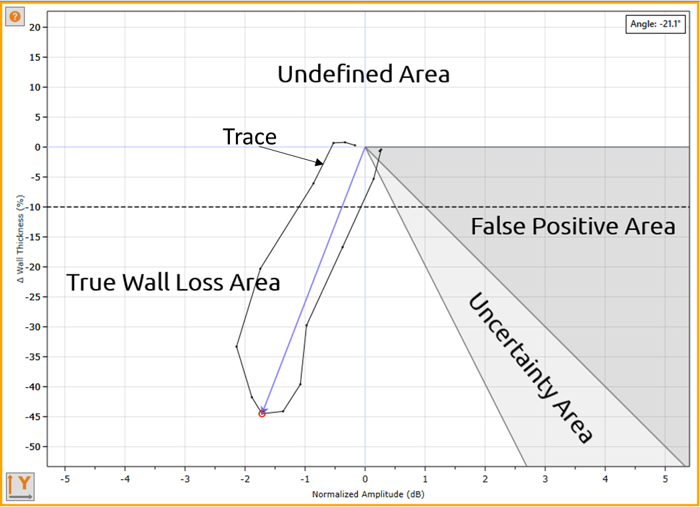 Figure 3: PermTool Area Definitions
The easy-to-read PermTool can thus be used by analysts who are confronted with various phenomena that could lead to false positives when analyzing pipes or other components. Among these phenomena, there is the cold pilger signatures, heat affected zones, and other sources of local property variations. The cold pilgering can sometimes be seen as an helicoidal band on the C-scan. On the other hand, local property variations could be, for example, the result of a deviation from uniform quenching procedures during component build or heat generated by a welding operation and can be easily mistaken for true wall loss indication.
Before the introduction of this Eddyfi exclusive tool, analysts had to rely on a combination of the C-scans, the individual A-scans, and the context gathered onsite to make accurate and reliable calls to distinguish true wall loss from false positive. Now, with the PermTool, PEC analysts drastically increase their capability to identify false positives which in turn can decrease unnecessary stripping costs for asset owners. The tool excels to assess detectable indications related, but not limited to, property variations, interfering components, hard spots, and heat affected zones. False positive indications caused by a temperature gradient excessing the recommendation of 20 degrees Celsius of variation of the component is more challenging. Hence, by following all the recommendations (ISO: 20669, API RP 583, and ASME BPVC section V) and using all the information available including the context, analysts now have a more complete toolbox to successfully assess indications.
To demonstrate the capability of the PermTool, two different C-scans were analyzed and presented below. The first one comes from an out-of-service pipe with known scab and blisters, and the other one comes from an in-service pipe component. Both pipes were scanned using a CWT (Compensated Wall Thickness) ready resolution with a single channel sensor and an encoder enabled dynamic scanning mode. The CWT is another Eddyfi advanced analysis tool used to provide a better estimate of the true remaining wall thickness when assessing a defect.
Figure 4 presents the result of the PermTool on the indication located on right side of the out-of-service pipe. The tool clearly identifies the indication as a true wall loss by using data in the Y axis. The scab effect can also be observed on the Tau-scan in which the signal shoots up. In addition, the non-scattered trace is related to good and well aligned C-scan data.
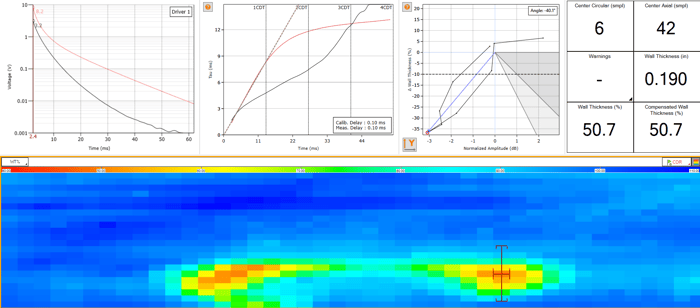
Figure 4: True Wall Loss on an Out-of-Service Pipe
In the next case, as demonstrated in Figure 5, the PEC analyst was able to accurately identify the cold pilger signature as a false positive using data in the X axis. This is also highlighted in the A-scan in which a stronger signal amplitude and a steeper slope early in time were observed combined with the signal crossing the calibration. The scattered trace also revealed that data quality could have been improved or benefit from a higher resolution scan. Nevertheless, the trace and vector are well correlated together.
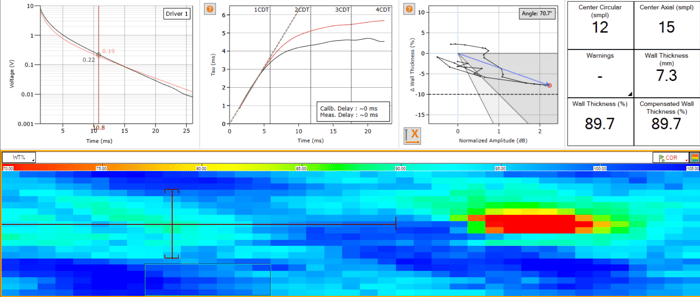
Figure 5: Pilger Effect on an In-Service Sound Pipe
Another example of the high capability of the PermTool to detect false positives is presented in Figure 6. This indication, possibly a hard spot localized within the cold pilger band, has also been correctly identified as a false positive by the tool using data in the Y axis. This is also visible in the A-scan in which the signal is crossing the calibration. On the Tau-scan, a signal saturation is visible (the Tau-scan shoots up at the very beginning) and is related to a significant change in the material properties.
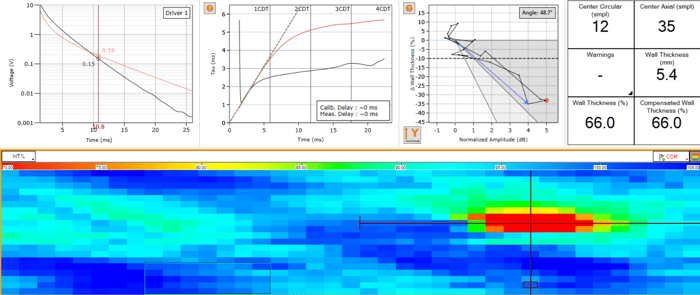
Figure 6: Property Variations of an In-Service Sound Pipe
These two examples showed that PEC analysts can more easily assess the nature of the indication as well as the data quality by using this advanced yet easy-to-interpret analysis tool that offers ease of use!
Conclusion
In conclusion, Eddyfi Technologies’ take on an advanced analysis toolbox for pulsed eddy current goes beyond the technology itself; it is a more complete solution that ensures better data assessment like never before. The limit of the technology related to changes in electromagnetic properties, or the presence of interfering components has been pushed again with a powerful, yet easy-to-use graphical tool designed to increase PEC inspection confidence by discriminating true wall loss from false positive indications more easily than ever. When used in conjunction with the other tools and when considering the context, PermTool helps analysts make the right decisions. With the constant evolution of post-processing analysis, it is no surprise that Lyft PEC technology is now being deployed to more efficiently address corrosion challenges in various industries from oil and gas to military ships.
Contact our NDT experts to discuss your next inspection challenge today!