Although a more recent non-destructive testing (NDT) technology, guided wave testing is now considered by asset owners to be a vital inspection tool. This is predominantly due to the ease with which the technique can be applied, providing high inspection productivity rates and its unique ability to inspect pipe areas away from the tool location, making inaccessible areas accessible. Since its release in the 1990s, GWT has seen improvements. Initially, only the longitudinal wave mode was employed. The more versatile torsional wave mode followed several years later. Even using both wave modes, defect classification was based purely on signal amplitude. Classifying a signal based on its amplitude alone does not accurately represent the severity of the defect.
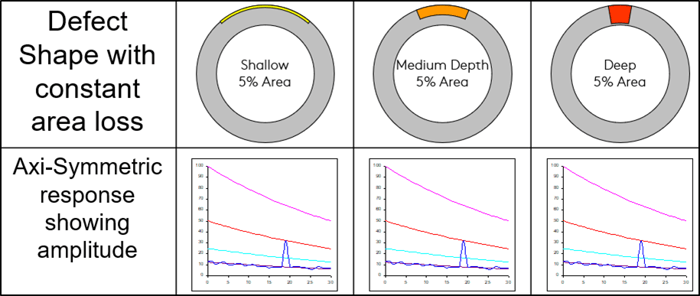
Figure 1: Amplitude Response of Three Defects with a 5% Cross-Sectional Loss
Figure 1 illustrates the issue of basing defect severity purely on signal amplitude alone. Each of the three defects has a constant loss of 5% cross-sectional area and, therefore, the same response amplitude in the corresponding A-scan displays. The defect highlighted in yellow has the greatest circumferential extent but the shallowest wall thickness reduction. When this defect is compared to the one highlighted in red, it's clear that, although they both represent the same material loss, the defect highlighted in red is the most severe and presents a significant problem to the pipeline. Practically this causes a problem. Signal amplitude does not give any information on the defect’s aspect ratio, making it more difficult to differentiate between wide and shallow or narrow and deep defects.
Relying on signal amplitude alone to classify anomalous guided wave responses provides limited information on the severity of any suspicious indications (see Figure 2 for amplitude classifications). We can still detect and follow up on these responses; however, classifying them as their amplitude can be problematic, especially when dealing with Category 1 indications; a category 1 indication describes the lowest amplitude that a signal can be prescribed. High amplitude reflectors will immediately be given a high priority follow-up as minor defects do not produce high amplitude signals. However, low amplitude reflectors can be attributed to severe defects, so additional information when scrutinizing this type of reflector is beneficial and an excellent classification aid.
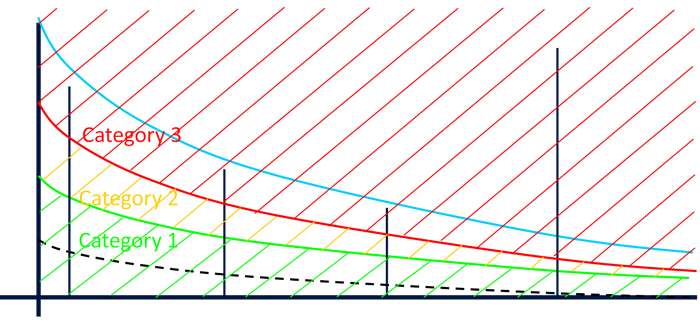
Figure 2: A-Scan Amplitude Classifications
Users of Sonyks guided wave testing equipment have the option to collect additional inspection data at the location of an anomalous signal. This supplemental acquisition is known as a focus test and provides information on a defect’s circumferential extent. Sonyks collects the NDT data in a revolutionary way using a combination of full matrix capture and broadband which means that this is no longer secondary data collection but post-processing. This has enormous benefits over the previous GWT collection method because focusing can now be done after leaving the site as it is contained within the originally collected data.
Focus tests employ flexural waves rather than the axisymmetric waves used in standard guided wave data collection. The guided wave tool performs like a phased array probe, firing specific segments to produce flexural waves which combine at a defect location, benefitting from constructive interference. Data is collected at eight points around the circumference of the pipe.
The data provided by the focus tests are displayed in a polar plot, as shown in Figure 3 below.
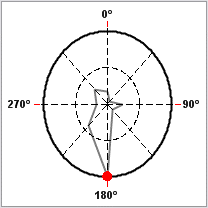
Figure 3: Focus Polar Plot Display
The bold outer circle represents the maximum amplitude signal (0dB level). The inner dotted circle represents a level that is 6dB (50%) lower than the maximum. The four diametrical dotted lines indicate the angular positions around the pipe's circumference.
The polar plot is constructed with information from eight separate A-scans corresponding to each of the angular positions around the circumference of the pipe.
In Figure 4 below, we can see eight colored traces on the focus A-scan display. Each one of these colored traces represents data collected from each focused angular position. The grey shaded area represents the focus depth of field. The largest amplitude trace seen in Figure 4 corresponds to the 0° position of the pipe; this is also highlighted by the red dot in the polar plot.
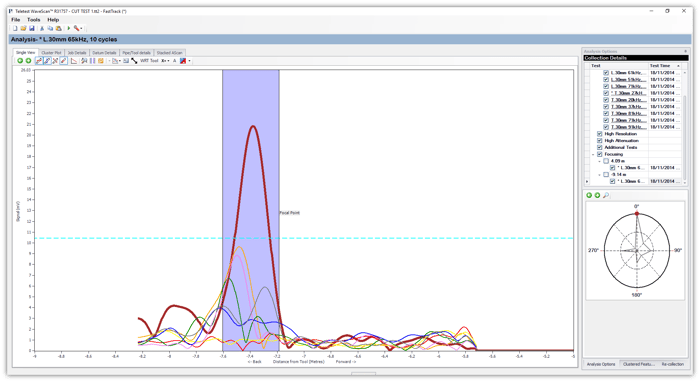 Figure 4: Focus A-Scans & Polar Plot Displays
It is clear to see that the other seven traces are much lower in amplitude; this is a good indication that the area of concern is localized around the top of the pipe.
Similar to the amplitude classification, focus data must be classified to allow each indication to be assigned a follow-up priority of either high, medium, or low priority. Classifications for polar plots are either directionality (Dir) 1, 2 or 3. These classifications are explained in Figure 5 below.
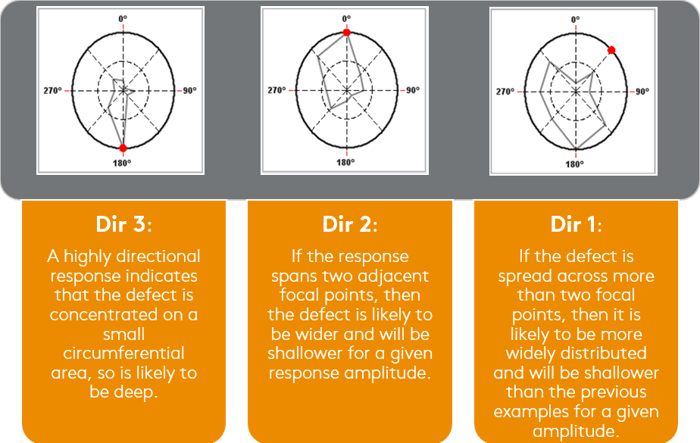
Figure 5: Focus Classifications
Once amplitude and focus information have been obtained, both can provide a more accurate assessment of the defect by way of a follow-up priority. The follow-up priority can be obtained by multiplying the amplitude score by the directionality score. The matrix table displayed in Figure 6 below gives guidance on follow-up priority.
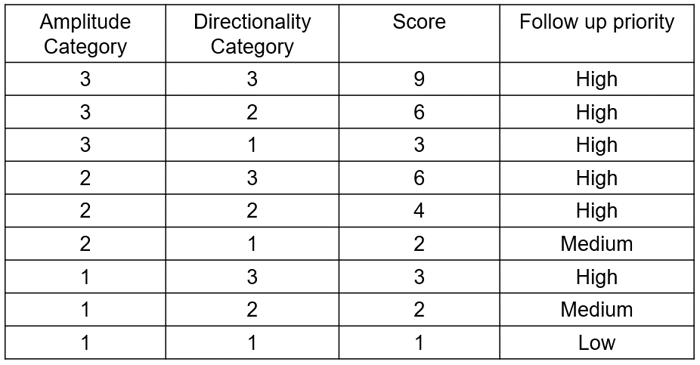
Figure 6: Follow-up Matrix
The matrix shows that responses that have an amplitude of three (3) will automatically be classified as a high priority. Responses with an amplitude classification of one (1) will be reclassified depending on the directionality response. Therefore, a low amplitude signal can become a high priority if the focus directionality is localized.
Although it is recommended that all anomalous indications in guided wave reports are followed up, the system above provides an order; the higher the matrix score, the higher the priority.
As with all NDT technology, there are always capabilities and limitations. Focusing is no exception to this rule. As previously mentioned, focusing employs the use of flexural waves. The more flexural waves available will improve the quality of the focus data.
The amount of flexural waves available is predominantly determined by the frequency under test. There are more waves available as frequency increases. This is illustrated in the dispersion curve display in Figure 7 below.
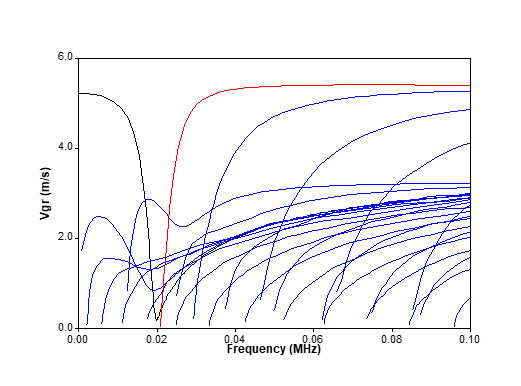
Figure 7: Dispersion Curve Display
Each of the colored traces in the dispersion curve displayed in Figure 7 represents a specific wave mode. The important factor here is that more of these waves are present at the display's right side. As the x-axis represents frequency, the right side of the display is in a higher frequency range than the left side. It's clear to see that more wave modes exist at higher frequencies.
In addition to frequency, pipe thickness and pipe diameter also affect the number of flexural waves available. Thick-walled and large diameter pipes support more flexural waves; this means that an ideal focus scenario is situations that provide more flexural waves.
Sonyks software can calculate favorable scenarios and give guidance on the expected quality of focus data based on these factors.
When selecting an indication for focusing, the software provides information on the expected data quality through a traffic light system. This is shown in Figure 8 below.
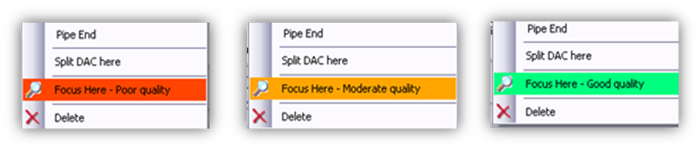 Figure 8: Focus Quality
Any pipe diameter above 150 millimeters (6 inches) should provide at least moderate quality; however, quality will increase with diameter, wall thickness, and frequency.
For a given pipe diameter and wall thickness, the optimum focus frequency will be the highest frequency in which the indication is visible on the A-scan.
Figure 9 below illustrates the importance of collecting focus data, especially when compared to Figure 1.
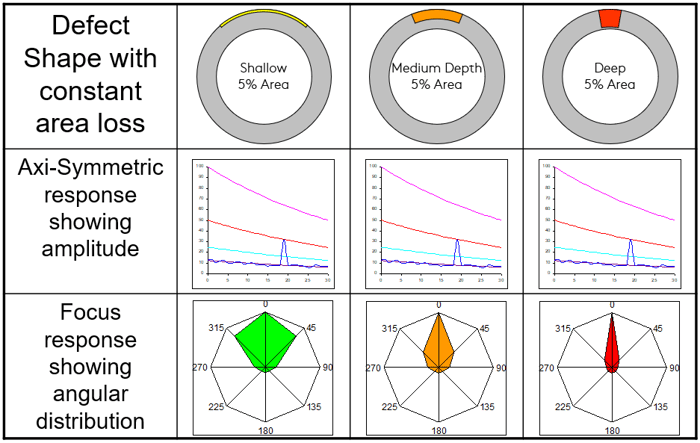
Figure 9: The Value of Amplitude and Focus Data
We can now see that the focus data has provided aspect ratio information for each of the three identical (amplitude) indications in Figure 9. The indication on the right of Figure 9 is more localized and therefore deeper than the other responses. The indication on the left is the least severe of the three as it extends further around the circumference and is shallower than its counterparts.
In Conclusion
Both amplitude and focus data must be obtained when conducting guided wave inspections to maximize the available information. The Sonyks long-range ultrasonic testing instrument by Eddyfi Technologies is the only guided wave system on the market that benefits from real-time focusing. Furthermore, it is the only inspection equipment that collects NDT data in such a way that focusing data can be extracted from the collected data. The information provided by focus collections allows for a more detailed evaluation of the severity of a defect; this is particularly important when investigating signals with a low amplitude, as this type of response can still be a concern for the pipe, especially if localized to a narrow circumferential position.
Ready to up your guided wave inspection capabilities? We invite you to contact our experts to learn exactly how our long-range ultrasonic testing solutions keep you Beyond Current.
Authors: Sean Hughes, Paul Jackson