
It's commonplace in most guided wave inspections to collect significant amounts of data. This data once processed and analyzed needs to be presented in a report document. The end product of any NDT inspection is the final report; this document is important for many years after we have packed up and left site. It is a permanent record of the condition of an asset at the time of inspection. The asset owner may use this document in several ways such as guiding follow-up inspection, using the findings for remaining life calculations, and proof of an ongoing asset integrity program which may be required by local regulatory bodies.
It is important to remember when producing a final report that the end client or reader is unlikely to have intimate knowledge of the inspection technique. They may be unable to extract meaningful information directly from an A-scan. Therefore, they rely on us as experts to translate this information and present it in a way which is useful to them. Creating a great report relies heavily on communication. How do we as inspectors translate complex information into straightforward, understandable content?
There are many ways in which we can strive to produce an excellent report document detailing a guided wave ultrasonic testing inspection. The Report Manager within Wavescan software, used in conjunction with the Teletest Focus+™ instrument, has been designed with this in mind. Incorporating photographs and isometric drawings are helpful and can be useful to explain things that would be very difficult and laborious to do in text format alone. Minimizing the use of technical jargon and information that the reader is unlikely to understand is also advisable. I saw an example of this recently when reviewing a guided wave final report. The inspector had identified an issue at a girth weld. He had highlighted this weld and explained that the weld exhibited a higher than expected flexural content. The guided wave inspectors among us will understand what this statement means. However, why would an asset owner? It is unlikely that they have had any guided wave training to understand what is meant by a high flexural response at a girth weld. This scenario could be explained in much simpler terms. What could be causing the high flexural response? We may not know for sure; however, a simple follow-up if accessible may provide some apparent causes.
An excellent example of guided wave inspections where large quantities of data are collected is trunk line inspections. Trunk lines are usually long sections of cross-country pipeline which can be ideal for guided wave inspections. For this type of inspection, it is common to collect data from over a hundred separate test locations (TL). When conducting this type of inspection, a great way to simplify the report is to use only one datum. In many cases, I have seen reports in which a different datum is used at each TL. Changing the datum at each TL is necessary on some guided wave applications. Process piping or lines with complex geometry require multiple datums as measuring around an elbow can introduce errors. Trunk lines are different in that that are usually straight sections. This article demonstrates the value of using one datum for this type of inspection; you may just incorporate it into your next suitable inspection.
TL01
The first scan on our trunk line is identified as TL01.
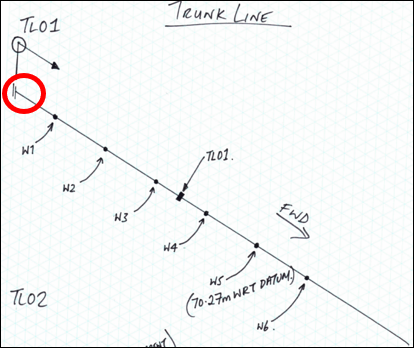
Figure 1: Pipe drawing – TL01
In this case, the datum has been set as the flange at the east end of the pipeline. This has been highlighted on the pipe drawing with a red circle. This pipe feature is our zero position and the point at which all other features are measured from. To make sure our datum is set correctly, we need to measure from the center of the tool position (TL01) to the flange. This measurement will be used when setting the datum in the Wavescan software, as shown in Figure 2 below.
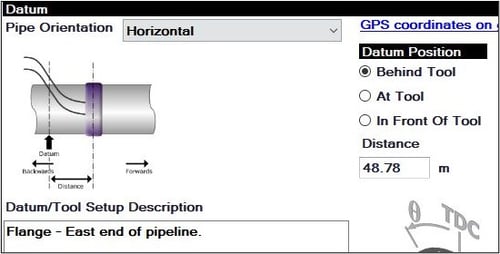
Figure 2: Datum set up in Wavescan software
The datum, in this case, is 48.78 meters (160 feet) behind the tool location. Once set, the flange at the east end of the pipeline becomes 0-meter mark on our A-scan display, as shown in Figure 3.
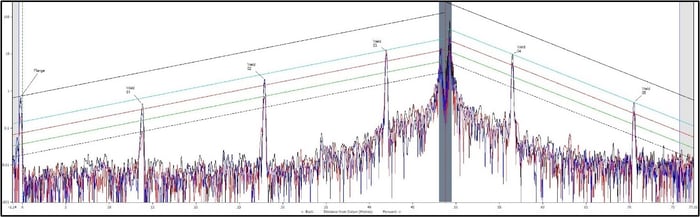
Figure 3: TL01 A-scan
Although slightly difficult to see in Figure 3, a 75 meter (246 feet) diagnostic length has been achieved. The scan terminates between welds 5 and 6. To be conservative and to achieve a small data overlap we will use weld 5 as an end of diagnostic length marker. This is clearer to see when viewing Figure 1. Weld 5 has a measurement of 70.27 meters (231 feet) from the datum. I have written this measurement on the drawing (Figure 1) as it will be needed for TL02.
TL02
When setting up from TL02, we will be too far from our datum point to make a physical measurement. In this scenario, we need to do things a little differently. When setting up our datum for TL02, we will initially do the following: the datum position will be selected as 'at tool' and the datum description remains the same as we intend to use only this feature for the datum throughout the entire pipe length.
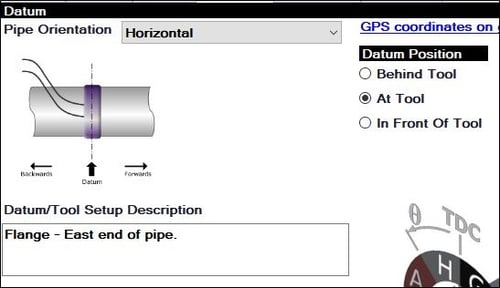
Figure 4: TL02 initial datum set-up
Once data is collected, we can make some adjustments to our datum measurement to make sure that the data is displayed from our original datum point.
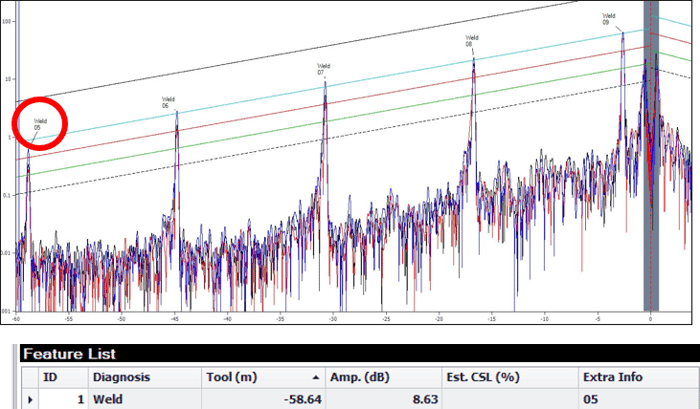
Figure 5: TL02 A-scan and feature list with datum set to tool position
As displayed in Figure 5, we can see that our weld marker (weld 5 highlighted by the red circle) is 58.64 meters (194 feet) behind the tool position. We have already decided that we would like all measurements from the flange position. To do this, we now need to do some simple math. I made a note on the drawing in Figure 1 that weld 5 is 70.27 meters (231 feet) from the datum. We now know that weld 5 is 58.64 meters (192 feet) from TL02 (the sixth weld behind the tool position). Adding both of these values together indicates how far TL02 is from the datum, and therefore provides us with our datum measurement. This calculation can be seen on the pipe drawing in Figure 6.
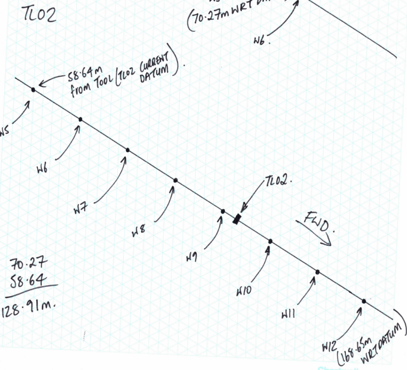
Figure 6: TL02 pipe drawing
Once this measurement is inserted in the software (Figure 7), all features in the TL02 A-scan will be with respect to the datum flange.
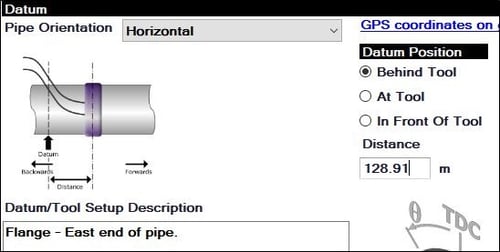
Figure 7: TL02 – New datum measurement
We analyze the TL02 scan in the usual way making sure to note the final weld distance inside the diagnostic length. In this case, it is weld 12 at 168.65 meters (553 feet) from the datum. This can be seen in Figure 8 below and marked on the drawing in Figure 6.
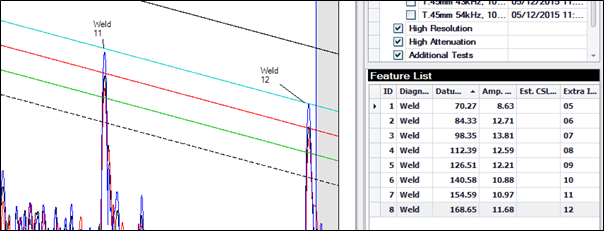
Figure 8: A-scan and feature list displaying weld 12 distance from the datum
TL03
When setting up from TL03, we will be too far from our datum point to make a physical measurement. In this scenario, we need to do the same as we did for TL02. Again, initially the datum position is selected as 'at tool' (Figure 4), and the datum description remains the same for reasons already discussed.
Once data from TL03 is collected, we need to identify how far the weld marker is from TL03. Remember, we selected weld 12 at 168.65 meters (553 feet) from datum (as shown in Figures 6 and 8).
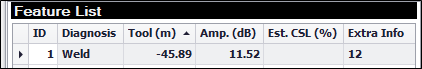
Figure 9: TL03 feature list
We can see from the Feature List in Figure 9 that weld 12 is currently 45.89 meters (151 feet) behind the TL03 tool position. We now need to replicate the calculation we did from TL02 but with different values.
Weld 12 was 168.65 meters (553 feet) from datum from TL02, and our TL03 position is 45.89 meters (151 feet) from Weld 12. Adding both of these values together gives us our TL03 datum. This value should then be entered into the datum tab in the Wavescan software as shown in Figure 10.
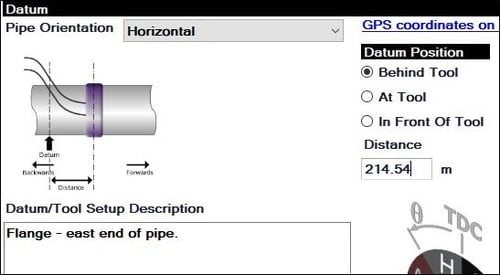
Figure 10: TL03 New datum measurement
Once complete, all features will be with respect to our datum flange. This process should be continued along the entire length of the pipeline, or until a change of geometry makes this method unsuitable.
The advantage of presenting the data this way makes for a more clear and concise report. If the pipeline is 2 kilometers (1.2 miles) in length, this measurement is reflected in both the A-scan data and any isometric drawings provided. In the case that anomalies are identified, the reader has a better understanding of where they might be located. An anomaly reported at 1,000 meters (3,281 feet) from the datum (in this case the flange at the east side of the pipe), has more meaning that an anomaly reported from 32 meters (105 feet) from a girth weld situated 26 meters (85 feet) behind TL32. This is helpful for planning follow-up work. The client has a good idea of what locations along the pipe length they need to access, considering any access restrictions, and can prioritize follow-up based on the anomaly locations. The method of reporting can also be useful when highlighting regions of pipeline that were not inspected.
Follow-up inspection should still be conducted in the same way, by measuring the location of any anomalies from the nearest pipe features (welds in this case). Subscribe to our blog to make sure you don’t miss out on future articles sharing more tips and tricks on how to get the most out of your Focus+ and Wavescan duo to deliver easily understandable reports that asset owners rely on for informed decision making.