
Smart Connectivity
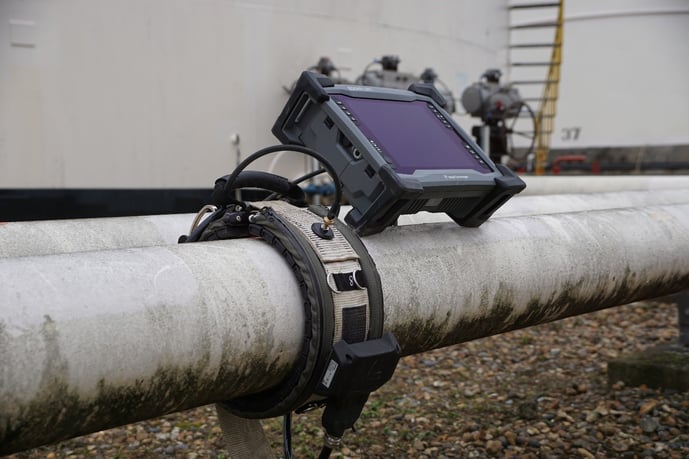
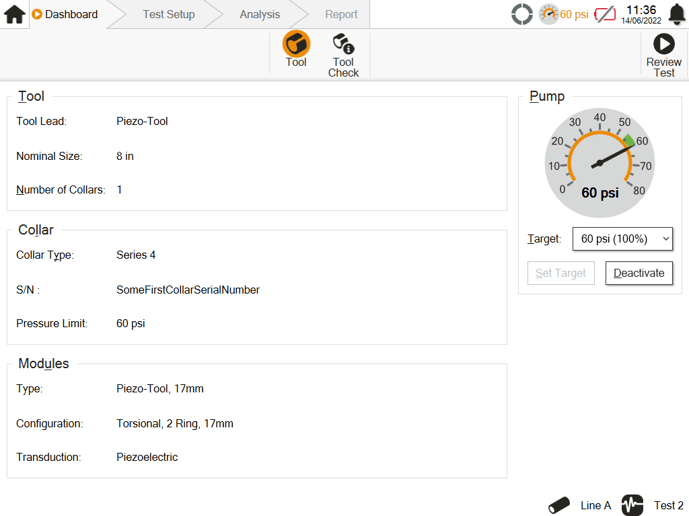
The LRUT system is simple to construct with only four components. This makes the setup lightning-fast and extremely portable. New piezoelectric tools are connected to the instrument via a single connector. The leads and the collars are self-identifying. The moment they are connected, the system automatically knows the type, size, serial number, pressure target, and other important details. They also contain sensors that inform the software about the orientation of both the pipe and the tool. We use this to give default answers to input fields making the software fast and easy, saving significant time when going through the initial setup.
Sonyks is the first of its kind with an onboard touchscreen for guided wave technology, meaning no laptop is required on site. One of the most noteworthy benefits is how quickly the system goes from car to pipe testing. After pulling up to a pipe location, the system is performing testing within a matter of minutes.
Project Intelligence
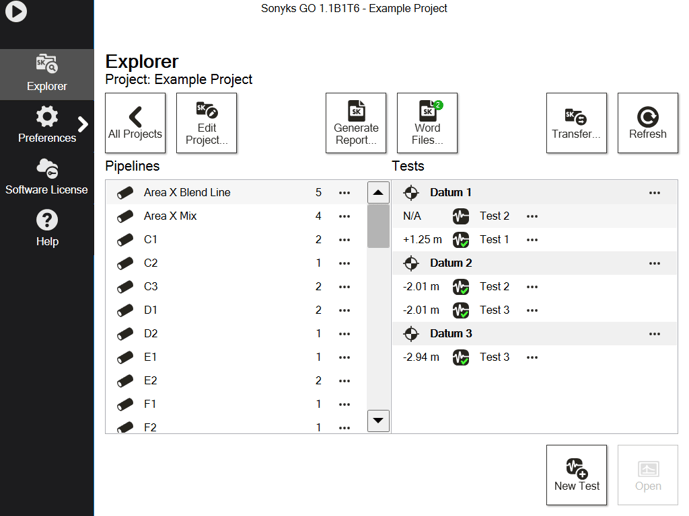
Sonyks organizes your work into projects with each project containing a hierarchy of pipelines, datums, and tests. Your project builds in a structured way that is ready for reporting. Sonyks uses its knowledge of the structure of your work to help you. The details for the pipelines and datums are only entered once versus every test. The default settings for a new inspection are taken from the previous test on the same pipeline. Frequently the details are similar, and there is very little input required. This works even if you switch between pipelines as you conduct your guided wave testing, or GWT, inspections.
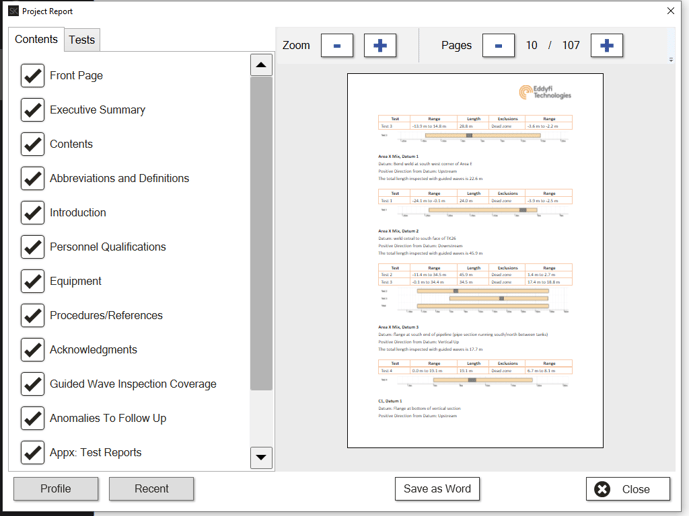
This structure also makes datums more useful. Multiple tests that share a datum can easily be reported together. The software reports the overlap of the tests and the net inspection coverage achieved between them. The position of findings across those tests are clear and easy to compare. The final report can display coverage via a pipe coverage map, making it very easy for the technician and end user to understand precisely what has and hasn't been inspected. This report content is created automatically with no additional work from the user. This feature alone offers the technician substantial time savings.
Simple Analysis
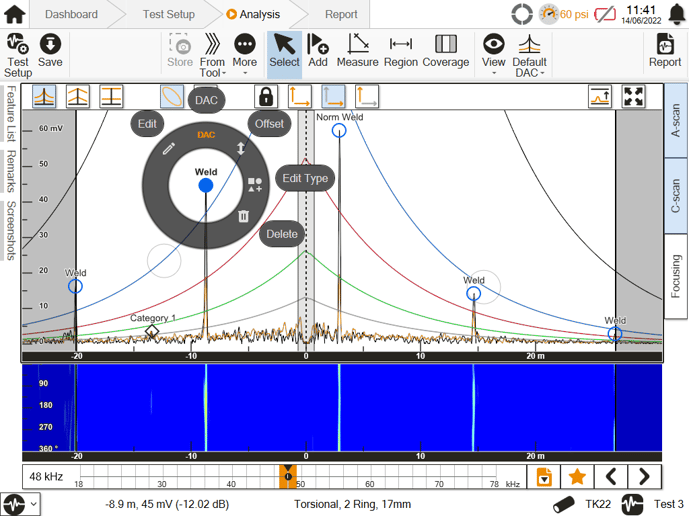
In the previous guided wave product, Teletest Focus+, the frequencies were acquired sequentially and presented as a list. Each one was separately acquired, and the user needed to work their way down the list analyzing each one. Sonyks allows operators to analyze and annotate all frequencies at once. The user can easily browse the data with the Frequency Slider which animates the A-scan and C-scan views. The touchscreen pinch-zoom and touch-pan, similar to the experience with your everyday smart devices, make exploring the data familiar and seamless. Moving around the data is fluid, so the operator can identify and inspect possible defects up close. The inspector can also take report-ready screenshots as they work, offering them content for reporting when they need it. These onboard software tools create simplicity that is welcomed by both new and experienced users.
Automated Reporting
Reports for both individual tests and whole projects are generated automatically. The work done during setup and analysis of each test automatically generates report content. The inspector can view and browse previews of the report within Sonyks as it develops. At the end of each test workflow, simply mark the test as ‘ready for reporting’.
Once ready, Sonyks can generate a project report by extracting data from all the tests and building meaningful chapters on a variety of topics. For example, there is a chapter on equipment which summarizes the equipment used across all tests. Each item of GWT equipment used appears once in this chapter whether it was used for one test or 100 tests. There’s also a chapter on guided wave inspection coverage. This shows how the tests overlap and the total diagnostic coverage between them. Another example is the “Anomalies to Follow Up” chapter that gives a concise and simple table of anomalies for the whole project with their location and information that can be used to prioritize their inspection. A detailed report for each test can also be included. Hyperlinks are used to allow users reading the report on a computer to quickly navigate and drill down into the details as they desire.
Automation now performs the work that was previously done manually in Microsoft Word. Days of work can be reduced to hours, freeing up more time on site and allowing for fast report turnaround speeds.
Ready to speed up your inspections?
Take control. Be your own guide. Contact our team of knowledgeable experts to learn more about how Sonyks can improve your inspection efficiencies today.
.gif?width=1091&name=ezgif.com-gif-maker%20(23).gif)