
Definition: What is Plane Wave Imaging (PWI)?
What you will learn in this section:
To understand PWI, we first summarize FMC (the full transmit-receive matrix), then show how PWI reduces the firing sequence while keeping enough information for TFM reconstruction.
Plane Wave Imaging (PWI) is a phased array acquisition mode where multiple probe elements fire simultaneously to generate an unfocused wavefront at a chosen angle, while each element records an elementary A-scan on reception.
By repeating this for a limited set of angles, PWI insonifies the region of interest with far fewer firings than FMC, enabling much higher scanning speed.
The recorded data can then be reconstructed with Total Focusing Method (TFM) to produce a high-resolution image comparable to FMC-TFM in many use cases, with significant productivity gains.
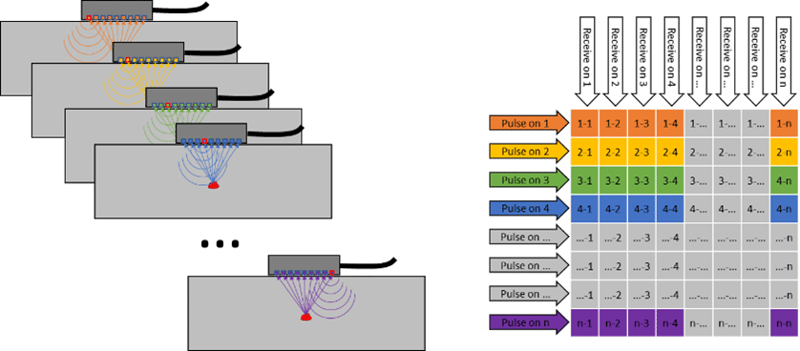
Figure 1: FMC sequence
The PWI Difference
Key idea:
PWI shortens acquisition by firing a small set of angled plane-wave beams using a multi-element aperture, while still recording one received A-scan per element, per firing.
With PWI, instead of firing each element individually in emission, we can select a multi-element aperture (typically full aperture of the probe), while in reception we record elementary A-scans – one for each element. This allows us to fire focal laws with varying angles or apertures to sufficiently insonify the region of interest for inspection.
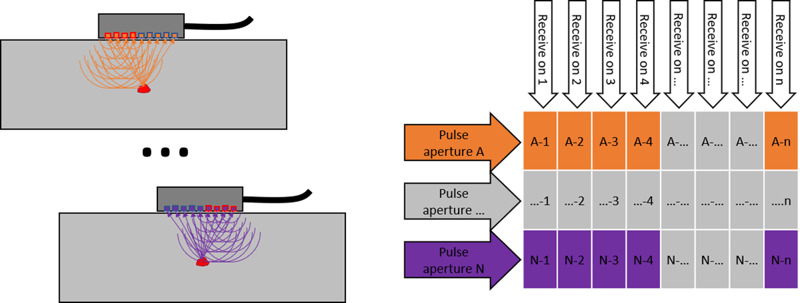
Figure 2: PWI sequence
We are able to select the beam angles that give us optimum coverage and target the area of inspection for the application, just like beam-forming phased array. Typically beams are unfocused and using the full aperture of the probe gives a large amount of acoustic energy into the component.
Weld example (what the angle set looks like):
- Target: full weld volume coverage using shear waves.
- Angle set: 40° to 70° shear waves in 5° steps (7 beams).
- Why it matters: 7 firings per position (PWI) versus 64 firings per position (FMC) translates into a major scan-speed gain.
With just seven beams to fire in emission for each probe position versus 64 for the equivalent FMC acquisition, we gain a huge improvement in scanning speed and inspection efficiency.
Figure 3: PWI firing sequence for weld inspection
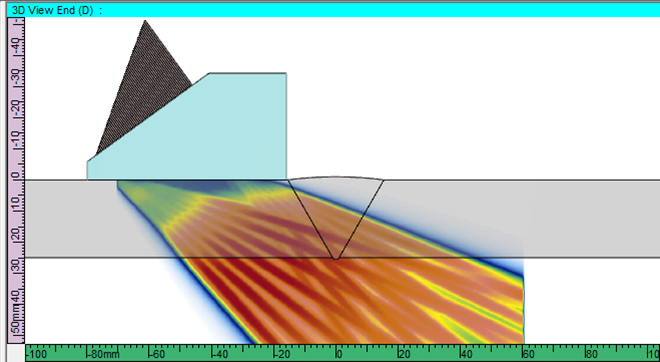
Figure 4: PWI emission beam coverage of weld
How Many PWI Angles Do You Need (and How to Validate)?
There is no universal number of PWI angles. The right angle set is the smallest set that still provides coverage of the region of interest and detectability of your smallest target flaws with acceptable noise.
Practical starting point (weld inspection)
A common starting point for weld volume coverage is 40° to 70° shear waves in 5° steps (7 angles).
Use this as a baseline, then adjust based on weld geometry, thickness, probe frequency, and the defect orientations you need to detect.
How to validate your angle set in practice
- Use a representative mockup (same thickness, geometry, and expected defect types).
- Confirm coverage: the TFM image must insonify the entire weld volume (no blind zones).
- Confirm sensitivity: smallest target flaws must be detectable with stable contrast above the noise floor.
- Confirm sizing performance: if sizing is required, verify repeatability against known reflectors or EDM notches.
- If results are marginal, increase angle count or widen the angle range until performance stabilizes.
Total Focusing Method for High Resolution Imaging
How it connects to PWI:
PWI defines how you acquire the data (fewer firings, selected angles). TFM defines how you reconstruct the image (time-of-flight focusing at every pixel) from that acquired dataset.
The next step after capturing the raw data is to process it into a highly focused TFM image.
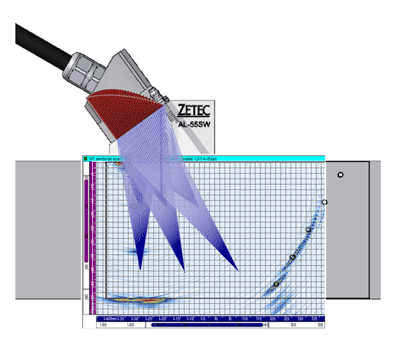 Figure 5: TFM calculation
TFM images are constructed from the PWI data by dividing the region of interest into pixels. In its simplest form, the ‘amplitude’ of each pixel is then calculated by considering the time of flight for each pulser-receiver pair, respecting a specific wave path, and summing these together. This creates an ideally focused image giving excellent image resolution for better characterization and sizing of challenging flaws.
Thanks to Eddyfi Technologies advanced solutions, TFM computation can be very fast, carried out live during scanning for real-time imaging or through post-processing of stored raw PWI or FMC data. Offering a range of advanced PAUT instruments and software; Cypher® and Panther™, and Emerald, supported by UltraVision®, support both real-time PWI as well as raw data recording for offline post-processing.
PWI vs FMC - Speed
The PWI method has several key advantages compared to FMC:
- High energy excitation provides greater sensitivity and better SNR.
- Higher Pulse Repetition Frequency (PRF) and scanning speed because of significantly shorter firing sequence and less elementary A-scan signals to process.
- Significantly smaller data file size for raw data saving.
Important: interpret speed claims in context
Speed depends on scan resolution, number of groups, encoded scan speed, and the number of firings (angles) per position. Use the comparisons below as example outcomes under the specific setups shown, then validate your own procedure on a representative mockup.
PWI of a comparable setup of FMC can be multiple times faster than FMC based TFM imaging and even faster than equivalent phased array setups for scanning speed, greatly improving efficiency and productivity of inspections. A practical example of this can be seen in Figure 6 with equivalent setups, imaging a cluster of weld porosity, acquisition is four and a half times faster with PWI-TFM than live FMC-TFM, and more than twice as quick as PAUT!
Key takeaway:
Reducing the firing sequence length is the primary driver of PWI speed gains, and it also reduces the amount of raw data to process and store.
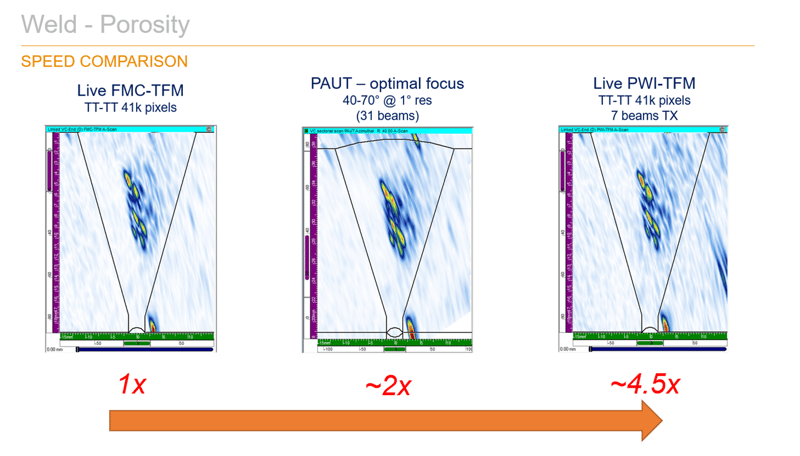
Figure 6: FMC, PAUT, and PWI Speed comparison
| Goal | Best first choice | Why | Validation step |
|---|---|---|---|
| High-resolution imaging at production scan speeds | PWI + TFM | Fewer firings per position increases PRF and speed | Validate angle set coverage on mockup |
| Maximum data completeness for complex post-analysis | FMC (recorded) + offline processing | Full transmit-receive matrix supports widest post-processing | Confirm file size and scan speed are acceptable |
| Fast screening with conventional setups | PAUT (or conventional UT) | Simple acquisition and established procedures | Confirm POD and sizing meet requirements |
| Attenuative materials where energy matters (example: HDPE) | PWI + TFM | Multi-element emission can increase energy and SNR | Compare noise floor and smallest detectable flaw |
| Need simultaneous modalities in one pass | PWI-TFM + other groups (TOFD/PAUT) | Single encoded scan can capture multiple datasets | Verify synchronization, coverage, and reporting format |
The Cypher is able to carry out simultaneous multi-mode PWI-TFM frames from two phased array probes at the same time as additional channels (e.g. TOFD, PAUT), so that in a single acquisition all of the relevant data can be captured in one go, without the need to perform multiple scans. In the video below, we can see PWI-TFM being performed from both sides of the weld at the same time as TOFD at a comfortable scan speed over 100 millimeters per second at 1 millimeter scan resolution!
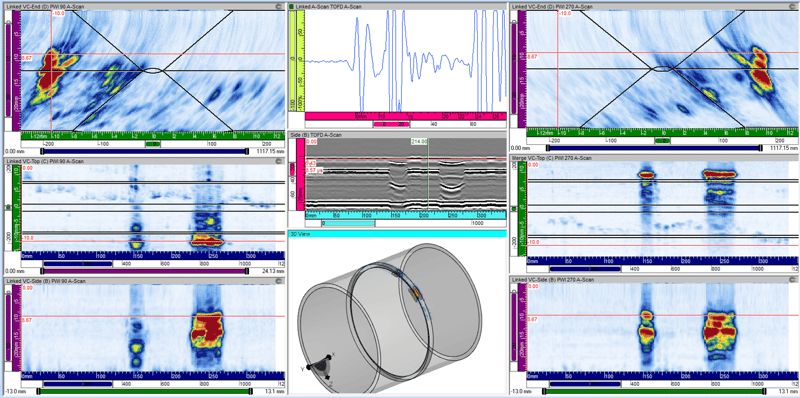
Figure 7: Multi-group PWI & TOFD data
PWI VS FMC – SNR
Direct interpretation (what PWI changes for SNR)
Because PWI typically emits with a larger aperture than single-element FMC emission, it can inject more acoustic energy into the part. In attenuative materials, that extra energy can translate into higher SNR, but results depend on your angle set, material attenuation, and defect type.
Thanks to the increased energy in beam emission compared to FMC, PWI can yield improvements for SNR on challenging applications. The application shown below shows comparative results of these modes for flaws in High Density Polyethylene (HDPE) pipe which has a large degree of attenuation compared to carbon steel. In the HDPE pipe example shown, the article reports a 13 dB SNR improvement for PWI versus FMC under comparable setups. Use this as a benchmark for what is possible in highly attenuative materials, then confirm results on your own geometry and defect targets.
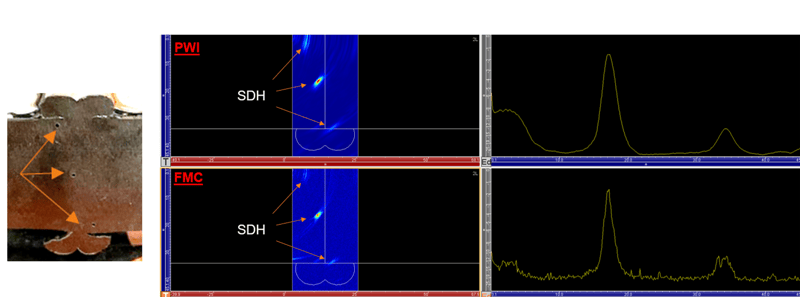
Figure 8: PWI vs FMC - SNR for HDPE
What About PCI?
Phase Coherence Imaging (PCI) sums the phase of A-scan signals rather than amplitude during TFM reconstruction and can be useful in the detection of small point reflectors such as pores or crack tips. The good news is that it can also be used with live PWI which can carry out simultaneous TFM and PCI imaging for optimum inspection efficiency.
Key takeaway:
If you already use PCI to enhance small point reflectors (pores, crack tips), PWI can be a practical way to keep PCI-capable imaging while increasing scan speed, as long as the chosen angles preserve adequate SNR.
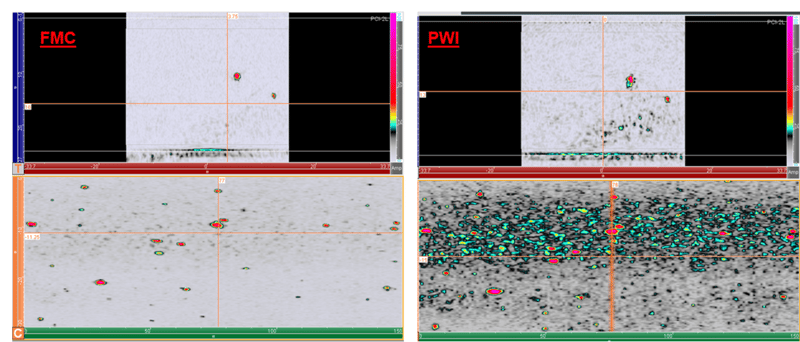
Figure 9: HTHA indications imaged with FMC and PWI
Looking at an example for High Temperature Hydrogen Attack (HTHA) – a damage mechanism characterized by ‘clouds’ of small pores – we can see the real power of live PWI-PCI combination when compared to FMC-PCI. Thanks to the PWI firing mode we can see a huge improvement in the detection capability identifying many smaller indications in the data and are able to better characterize the HTHA damage extent.
Post-Processing of PWI Data
Why post-processing matters:
Recording raw PWI data can unlock additional offline reconstruction options (for example different pixel resolutions, wave paths, and advanced algorithms) when you need deeper analysis than live imaging alone.
For most instruments performing live TFM, the raw data is not stored once the TFM image is computed. However, it is possible to record that raw FMC or PWI data for post-processing, either for a single scan position of interest or encoded for a full scan. Recording FMC data has historically been intensive due to the large data files and slower scan speeds. However, PWI adds another benefit here. File sizes for raw PWI data are comparatively much smaller than FMC and consequently scan speeds are much more manageable when storing. With post-processing giving access to offline computation for in-depth analysis; this includes use of advanced algorithms in the UltraVision software package, user configurable pixel resolution, and wave paths. PCF and DMAS are post-processing approaches that can improve image contrast in some datasets by reducing incoherent contributions, but performance is application-dependent and must be validated against your acceptance criteria. An example, Figure 9 shows the same porosity from the example above, where the stored PWI data has been constructed with Phase Coherence Factor (PCF) & Delay Multiply and Sum (DMAS) algorithms, showing significant improvement in SNR.
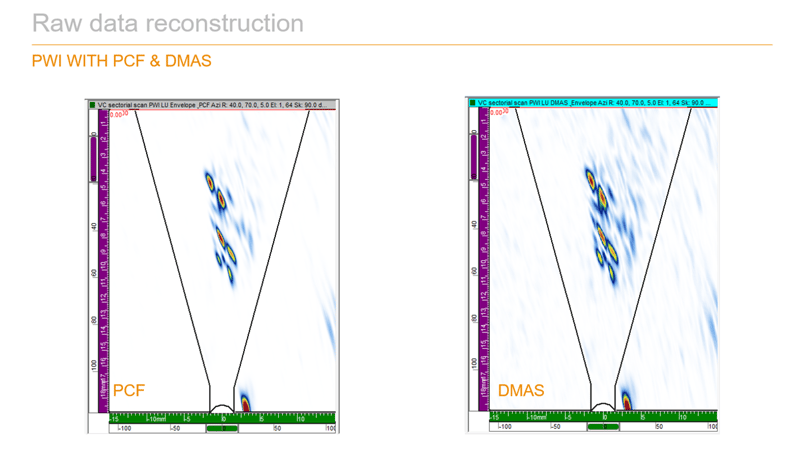
Figure 10: PWI raw data reconstruction with PCF and DMAS
Practical Implementation Checklist (PWI for Production Scanning)
Use this checklist to reduce false calls and avoid under-covering the inspection zone.
Setup
- Define the inspection goal (detection, characterization, sizing, or all three).
- Choose probe frequency and aperture for the smallest target flaw and expected attenuation.
- Define the region of interest and the wave paths you will use in TFM reconstruction.
Angle set and acquisition
- Start with an angle set that covers the full volume (for welds, use a proven baseline such as 40° to 70° in 5° steps, then adjust).
- Confirm PRF and encoded scan speed match your scan resolution requirements.
- If running multiple groups (PWI-TFM plus TOFD or PAUT), confirm synchronization and data completeness in a single pass.
- Record representative raw data for offline review if acceptance criteria are tight or if procedure qualification requires traceability.
Interpretation and reporting
- Interpret SNR improvements as setup-dependent, and compare against defect-free zones to estimate noise floor.
- Use consistent display settings and document your reconstruction parameters (pixel size, wave path, angle set).
- Validate detection and sizing against mockups before deploying the procedure in production.
The benefits of PWI and TFM are evident, offering faster scanning speeds and higher resolution TFM imaging while improving overall probability of detection when up against challenging applications. To learn more about our advanced PAUT inspection solutions, contact our experts today, and subscribe to the blog to stay Beyond Current with weekly news delivered direct to your inbox!