
When performing PAUT inspection, operators are very often confronted with the need to interpret the origin of various echoes, especially for components that exhibit complex geometries. The ultrasound can rebound off various surfaces leading to a lot of geometry echoes, and it can be difficult to visualize echoes coming from defects.
To help operators, some systems like the Gekko® and Mantis™ can overlay a cross-section of the component onto the PAUT data. The following image shows the Total Focusing Method (TFM) result of an IIW TYPE 1 mockup using a 128-element 2 MHz probe overlaid on a cross-section of the mockup. We can see reflections coming from all features of the block.
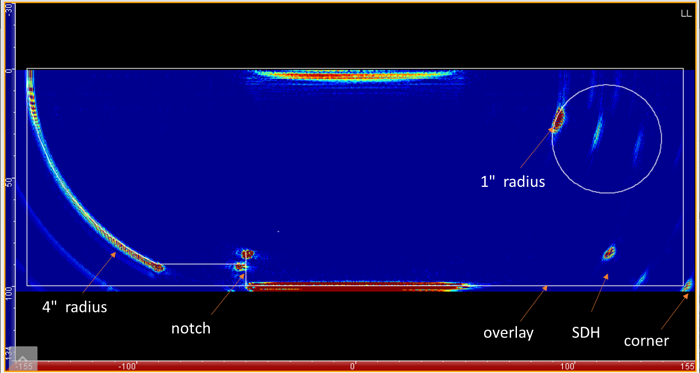
While this feature is already of great help, it is limited to just being an overlay, i.e., there was no interaction with the geometry.
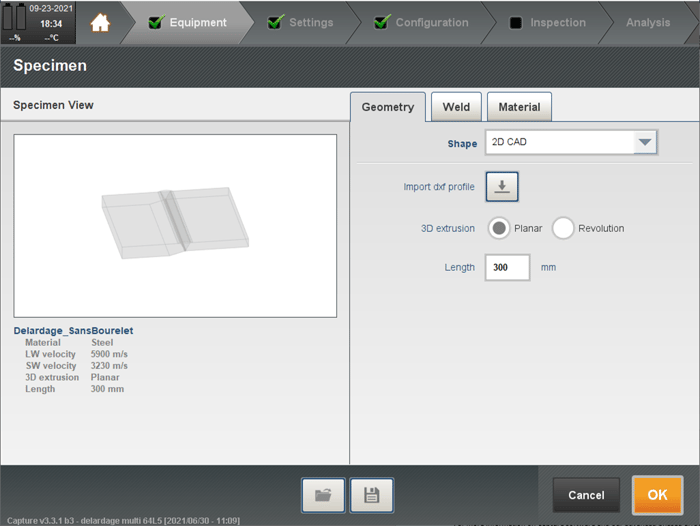
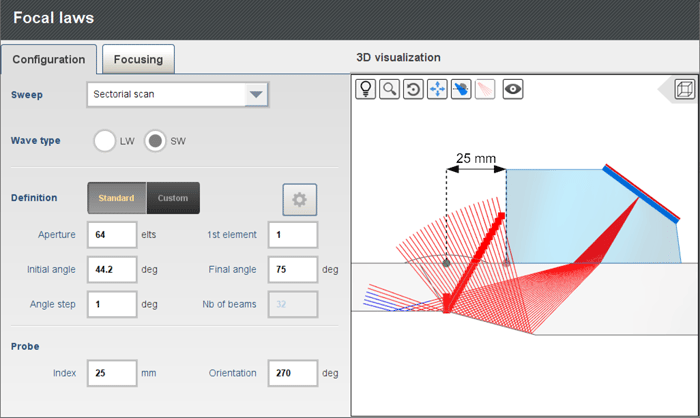
In Capture 3.3, we introduce a new component called 2D CAD. Operators can import dxf files that can then be extruded perpendicularly to the profile (planar extrusion) or revolve along the horizontal axis (revolution extrusion). The following image shows the Capture interface for the 2D CAD component with the extrusion options.
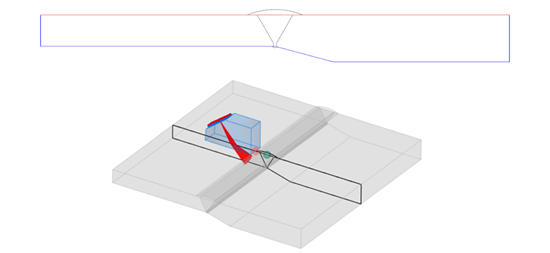
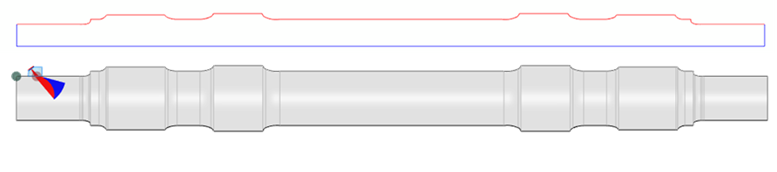
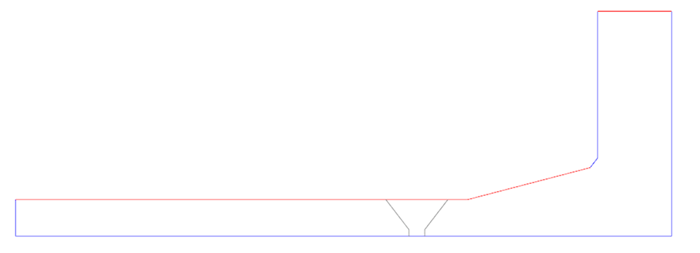
Capture is using a color code to indicate the front surface (red), surfaces where the ultrasound can rebound (blue) and commentary (grey). The following images show the profile of a tapered weld and its planar extrusion (top) and of a train axle with its revolution extrusion (bottom).
The index offset can then be adjusted to position the probe along the red surface and up to 20 rebounds can be calculated between any blue surfaces and the front surface. The grey lines are typically used to add commentary and no interaction is being calculated with them; the ultrasounds just simply go through them. For the tapered weld, the grey lines are used to draw the bevel of the weld.
To prepare their scan plan, operators can then select any focal laws and see the corresponding ray tracing with reflections off any surfaces going full skip or up to 20 rebounds. When using focusing, focal points move along the rays as well to allow for inspections to position exactly the points of focus. This is a great visual aid to verify if the ultrasounds are perpendicular to a bevel for example, to select the proper angles to reach a particular location within a component, and to select the proper area for focalization. The near field information introduced in Capture 3.2 allows one to see if the distance is too far for focusing.
The following video shows the entire process for the tapered weld from component definition all the way to data acquisition and analysis.
Taking into account the rebound off the taper when reconstructing the S-scan allows one to correctly reposition all the indications. This also helps greatly when it comes to sizing as echoes, especially tip diffraction, are repositioned at the right locations.
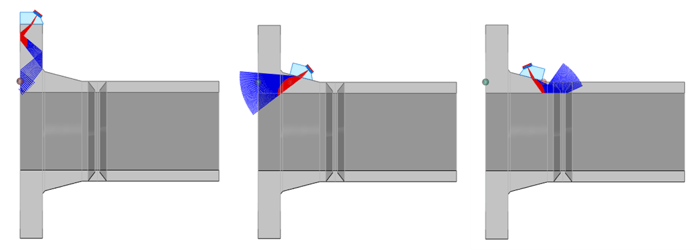
Many components can be described by a profile with a linear extrusion or revolution. Another good example are flanges. We can see below a 2D profile that was created to represent a flange. Red lines were used to allow the operator to position the probe on the taper surface or the hub. The ultrasounds can rebound on any blue surfaces (and red). A weld was added using the grey lines.
The following images show the flange in 3D and the probe positioned on those surfaces of a 4-150-WELD-NECK-FF-120 flange.
The following video shows the flange face corrosion inspection from the tapered surface of this flange from component definition to analysis.
The possibilities for this new feature are endless as many components can be described by a profile. This can help operators set the proper scan plan to obtain better sensitivity and better sizing capability. Overlays of components are important for the interpretation of all the echoes, allowing operators to distinguish between indications and geometry.
For more information on Capture software and our advanced phased array ultrasonic testing offering, contact our experts today!