
Tip #1 – Automatic Landmark Detection
Magnifi offers a tool for the detection of heat exchanger tube sheets and support plates. Once configured, it automatically identifies and positions the landmarks on acquisition stop or at data file reload. Knowing the position of the landmarks is useful for signal analysis, but it also offers the advantage of estimating the axial position of the defects in the tubes, assuming that the probe was pulled at a mostly constant speed during the acquisition.
The screenshot below shows a typical configuration for detection of the tube sheets only. In-depth information about all the parameters of this tool is explained in this Magnifi 4 software overview and application guide.
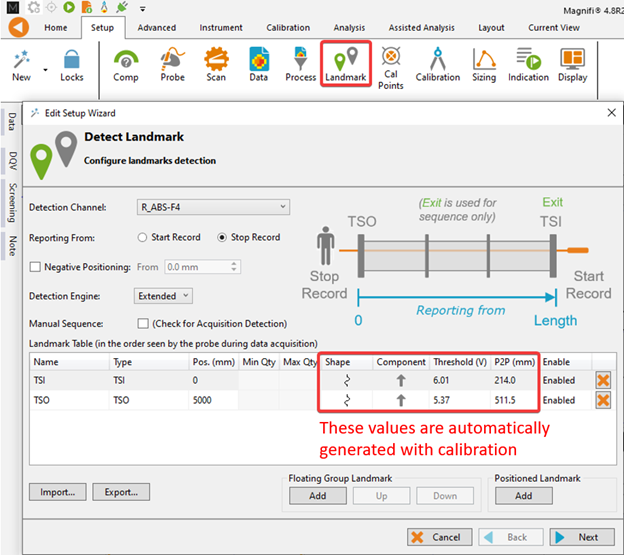
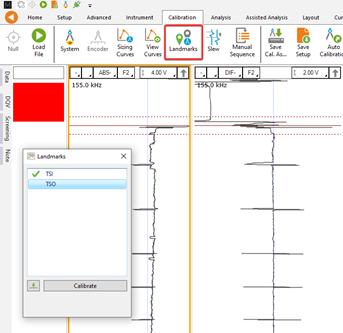
Once configured, a simple calibration of the landmark signals is required. This is done the same way the channels are calibrated over the through hole.
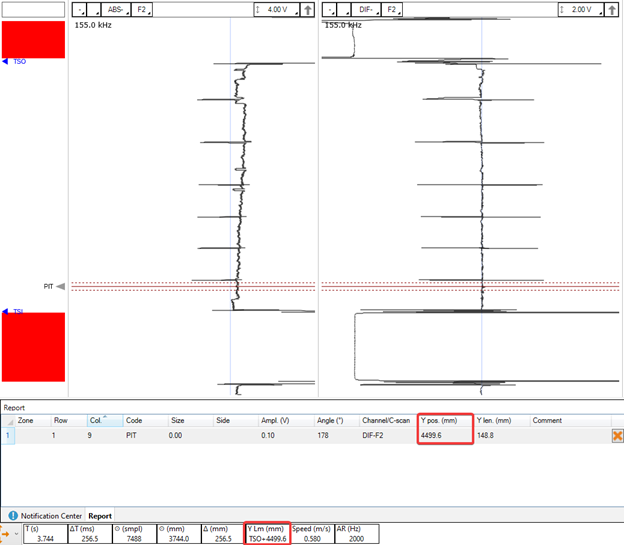
The tube sheets are identified by the blue triangles in the code view. Also, the defect positions shown in the infofield are now relative to the tube sheets.
Using this tool provides an easy way to add extra value for your client as it allows the generation of a report using TubePro™ with defects positioned in the heat exchanger, giving better insight of the asset’s condition.
Tip #2 – Manual Sequence
This next tip focuses on increasing productivity during inspection by still taking advantage of the automatic detection of landmarks. The manual sequence is a feature allowing a probe operator to perform data acquisitions without having to manipulate the laptop’s keyboard or mouse. Therefore, the use of this tool enables a single person to efficiently conduct the typical two-man job acquisition process.
Basically, this tool uses the automatic detection of the air tube signal during the acquisition to start/stop recording the files, so the operator does not have to hit the start/stop buttons. Here is a video showing it in action.
To configure the manual sequence, simply access the menu through the Calibration ribbon and edit the fields as per your preferences. With the configuration shown on the following image, the recording of the data will start 0.5 seconds after the detection of the exit signal, which corresponds to the transition from the tube to the air. The recording will stop on detection of the TSO near the probe operator. Then, a delay of 2.5 seconds has been set to leave just enough time for the operator to insert the probe into the next tube. Acquisition of the next planned file will then resume; recording will only start once the probe reaches the exit again.
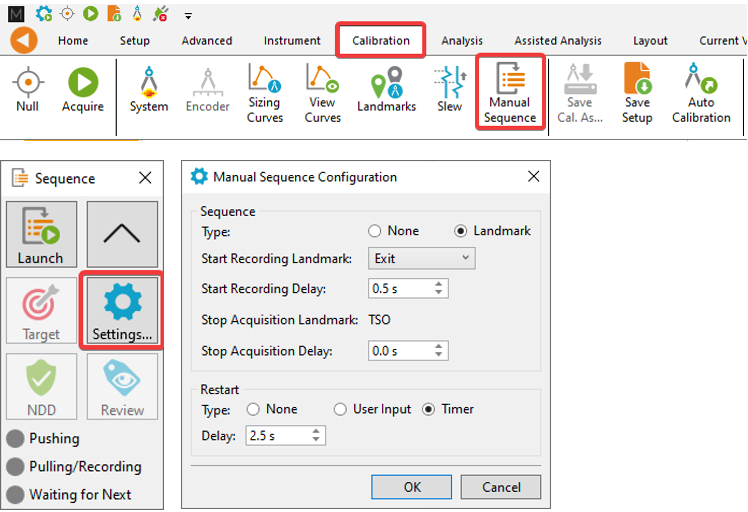
If an obstruction prevents the probe to exit the tube, the button “target” can be pressed manually to simulate the detection of the landmark without having to stop the sequence.
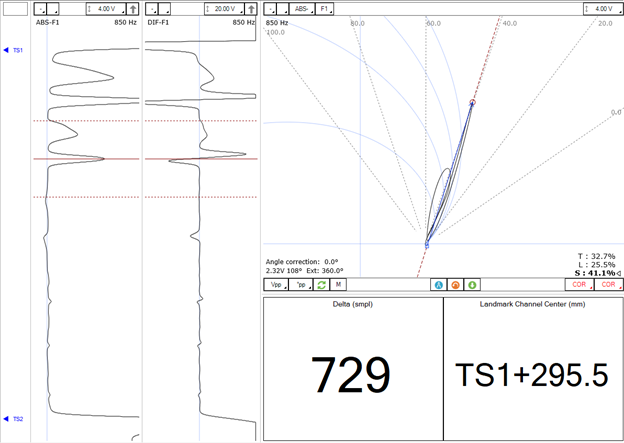
Tip #3 – IRIS’ Interactive Infofields
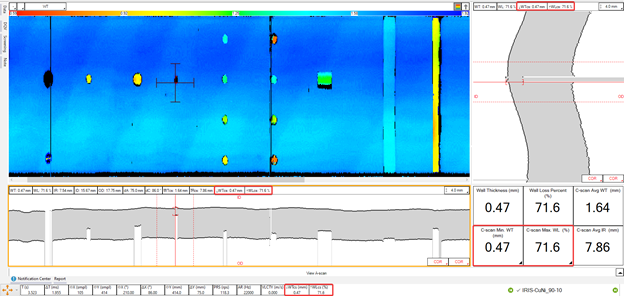
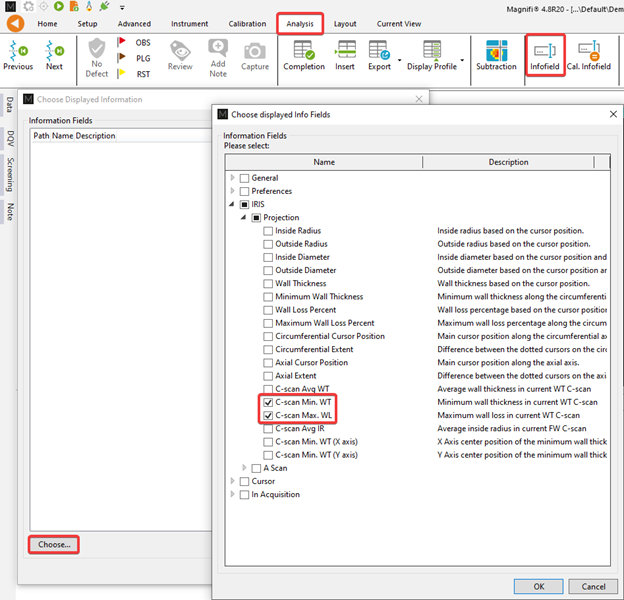
Did you know that the “C-scan minimum WT” and “C-scan maximum WL” infofields in an IRIS setup are clickable? Clicking on them will automatically move the cursor to the location in the C-scan with the minimum wall thickness (WT) or maximum wall loss (WL). It is important to note that it will only consider the portion of the C-scan currently shown on the screen. Therefore, it allows you to find the deepest indication on either the whole scan or just a specific region of the tube.
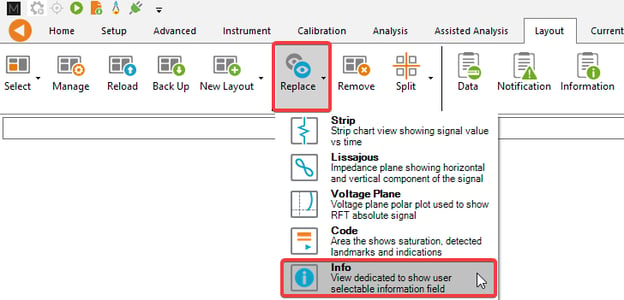
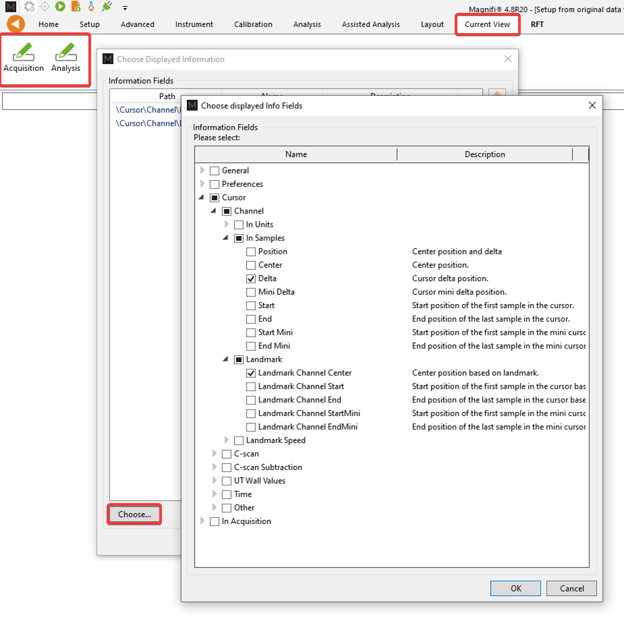
The infofields can be displayed at different places in the interface: at the very bottom in the infofield bar (1), in the header of the projection views (2), or in a dedicated infofield view (3). The image below shows how to add the infofield in the bottom bar. The other adjustments are described next.
General Tips and Tricks
In this section, we rapid-fire additional tips and tricks to help you improve your productivity when using Magnifi for any kind of tubing or surface inspection.
Getting Ready for Acquisition
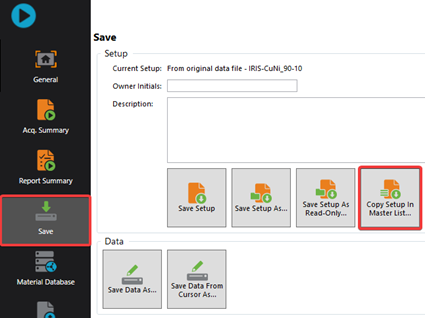
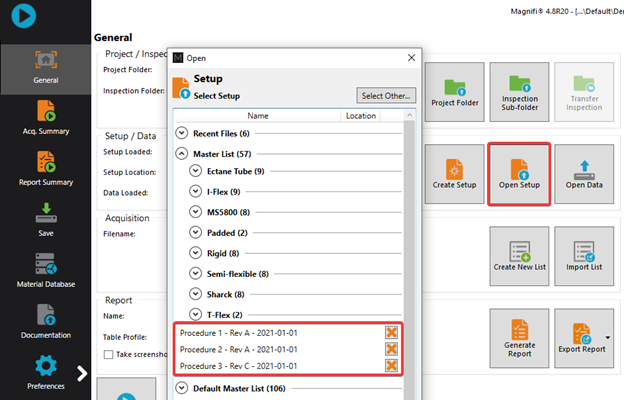
Tip #1: Once a Magnifi setup has been approved for a specific inspection procedure, it is possible to save a copy to the Master List to always have it easily available. This way, you will not have to search through the folders on your PC to find it when needed. Also, even though it is possible to modify the setup while using it, it is not possible to overwrite it. Therefore, it is protected from unwanted modifications.
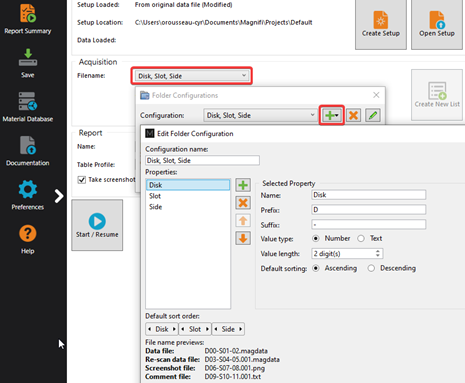
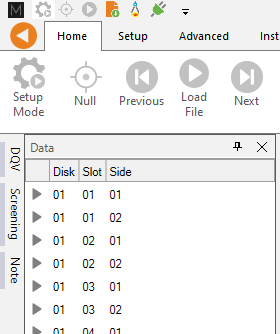
Tip #2: As most people in the tubing inspection world know, the data list creation feature can be used to generate a list of planned files to acquire with the rows/columns numbered for each tube to inspect. Using the “Custom” filename format allows full customization of the properties and sorting criteria. The following image shows how it can be useful for other types of configurations such as the inspection of gears or turbine disks.
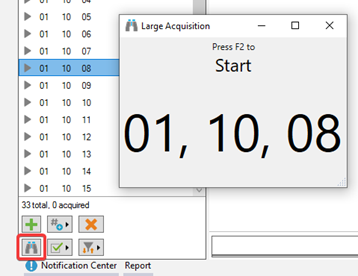
Tip #3: The large acquisition window is practical for all acquisitions but becomes especially handy when using the manual sequence. Indeed, this window shows the next planned file to inspect in big bold characters. Therefore, it is easy to keep track even if you are standing further away from the monitor.
 Analysis
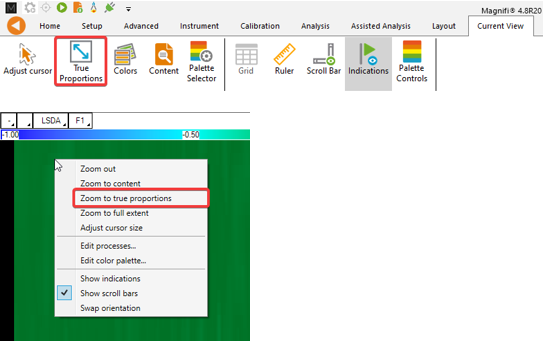
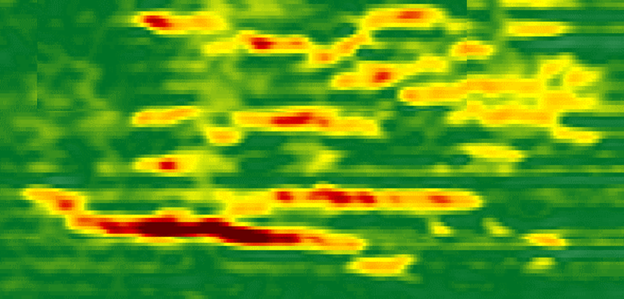
Tip #4: For data containing C-scan views, especially when the scan is encoded, the Zoom to True Proportions button zooms in on the scanning axis to provide a 1:1 ratio. The shapes of the indications are then more representative of the defects, making it easier to understand the geometry of the defects and to do a side-by-side comparison with a picture taken during a visual inspection.

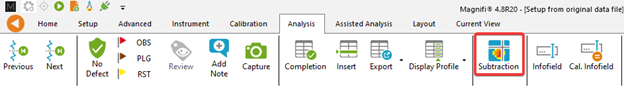
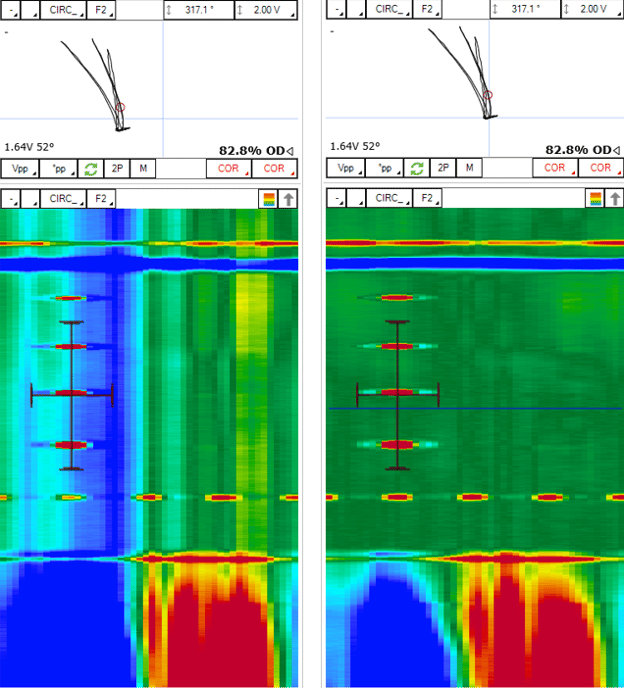
Tip #5: Another useful feature for analysis of data with C-scan views is the subtraction cursor, represented by the blue draggable cursor in the C-scan of the image below. This tool simply shifts the signal in the impedance plane, similar to a software null operation. This can be practical for removing noise such as liftoff variations without having to use a filter, which can distort the signals.
Tip #6: Large infofields can be added to the layout, making the most relevant information accessible at a glance. They can be configured for both acquisition and analysis. For instance, it can show the distance traveled by the encoder during a scan, or it can make important information visible on the screenshots taken for the report.
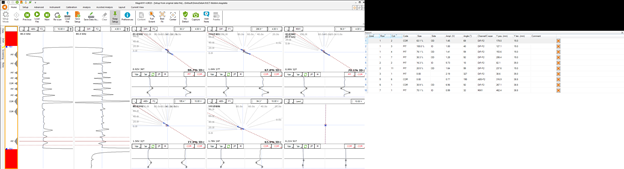
Tip #7: To have access to as much information as possible during data analysis, we often like to use setups configured with numerous views. Layouts with one code view, four strip charts, six Lissajous having each their own mini-strip charts are far from uncommon. Adding the report at the bottom of the screen is practical but can render the layout too compact for optimal analysis.
The report can be undocked from the bottom of the application and moved anywhere on the screen, even on a second monitor. Therefore, the frontstage of Magnifi with all the views can remain maximized while also having the report displayed full screen.
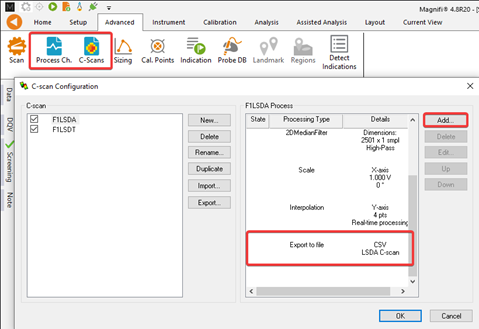
Tip #8: This next one is more complex but opens a world of possibilities. Through the C-scan or Channel advanced menus, the “Export to file” process can be added to automatically export the data to a .csv file on stop acquisition or at data reload. The generated .csv file consists of a list of values representing the signal in the impedance plane for each of the samples contained in the data file.
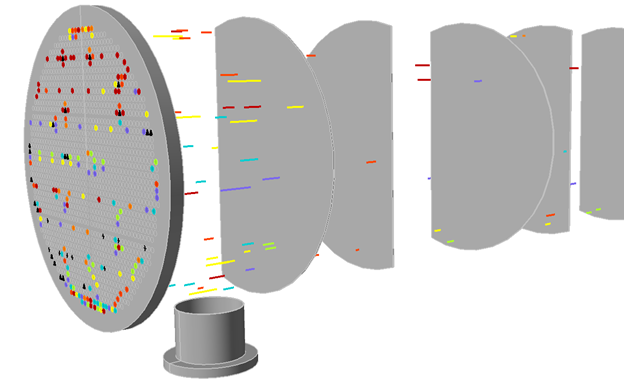
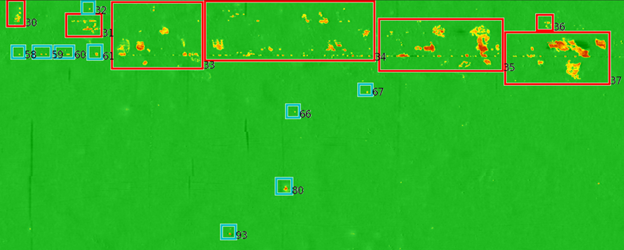
From there, one could create any script to process the data, perform automatic analysis, stitch data files together, etc. At this point, the only limit is your imagination (and your programming knowledge…). For instance, the image below was constructed using a custom script that stitches together several single pass scans and automatically identifies the stress corrosion cracking colonies in red and the manufacturing defects in blue.
View Properties
It is important to know that each view displayed in the interface has its own customizable properties. To access and modify them to your needs, simply select a view by clicking anywhere on it so its borders become orange. Next, click on the current view ribbon. This ribbon allows the configuration of several basic parameters such as the source of the signal (channel or C-scan), the displayed orientation, the measurement vector, etc. Note that the modifications are only applied to the selected view, not all the views of the same type. Now we’ll review some of the options that may not be familiar.
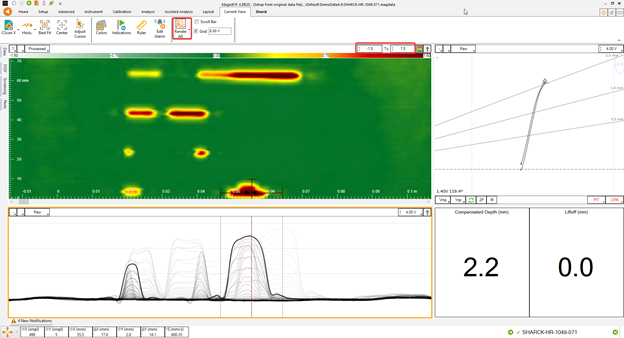
Tip #9: The “Render” option determines whether the data displayed in the view comes from a single channel (at the center of the cursor) or all the channels within the cursor, or all the channels of the C-scan. As shown below, it can produce very interesting views for analysis.
Tip #10: The C-scan “Palette Controls” can be added for quick drag and drop of the color palette range without having to open the “Palette Selector” menu as shown in the image above.
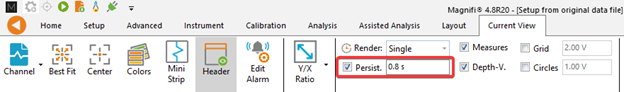
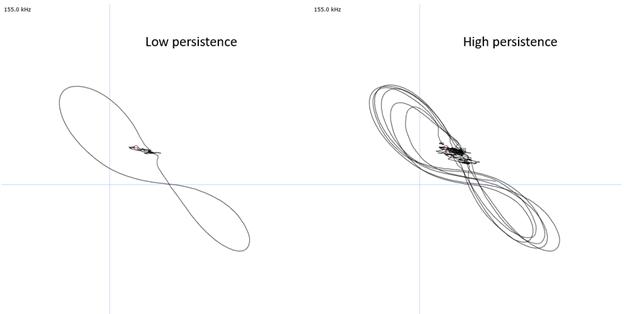
Tip #11: The “Persistence” option for the impedance plane represents the duration each sample stays displayed during the acquisition. Increasing the persistence will increase the amount of data that will remain accumulated in the Lissajous.
Mouse Functions and Keyboard Shortcuts
As with any software, a key to productivity is using available keyboard shortcuts and other mouse controls. Here we review some of the tools available with Magnifi.
Tip #12: The following are some basic but most useful mouse and keyboard controls to efficiently manipulate the data.
|
View |
Control |
Effect |
|
Lissajous |
Left mouse button: Hold down and move mouse |
Pan |
|
Lissajous |
Right mouse button: Hold down and move up/down |
Zoom in/out |
|
Lissajous |
CTRL + left mouse button: Hold down and move up/down |
Rotation |
|
Lissajous / Strip chart |
Spacebar |
Center |
|
Strip chart / C-scan |
SHIFT + left mouse button: Hold down and move |
Pan |
Tip #13: Of course, you can’t operate Magnifi without using some of the basic default keyboard shortcuts such as:
-
F6: Null
-
F2: Start/Stop
-
N: Report file as NDD
-
T: Tag file for review
-
F7/F8: Previous/Next indications
The complete list of keyboard shortcuts is accessible through the backstage: Preferences > System > Keyboard… Note that the shortcuts can be modified.
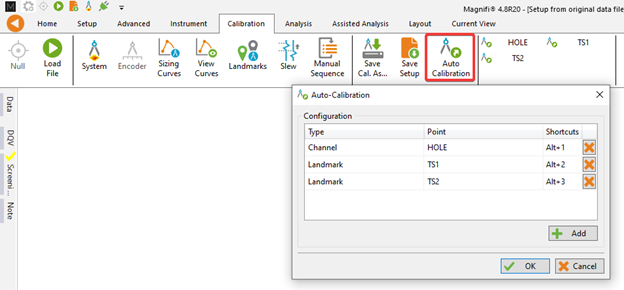
Tip #14: Shortcuts can be added for quick calibration of the channels, C-scans, and landmarks (not the sizing curves). Once configured, you simply place the cursor on the right location and press the keyboard shortcut.
If you’re not already subscribed to our Beyond Current blog, you’re going to want to get on the list for an article that reveals the secrets to better surface inspections! Eddyfi Technologies is committed to providing you with the best available technology for better inspection results and decision making. Contact our team of experts to discuss your next job today.