
I was first drawn to guided wave testing when I was closely involved in developing a short-range guided wave tomography system in 2012. During that period, I learned much about guided waves and the technique's potential. Last year I completed the CSWIP L1 guided wave training course. This was an excellent opportunity for me to deepen my GWT knowledge to better assist potential users. We used Eddyfi Technologies’ older generation Focus+ system and the Piezo-type collars during training. The training went great, and towards the end I felt confident in my skills to operate the equipment. You really had to pay close attention to what you are doing when collecting data and during analysis.
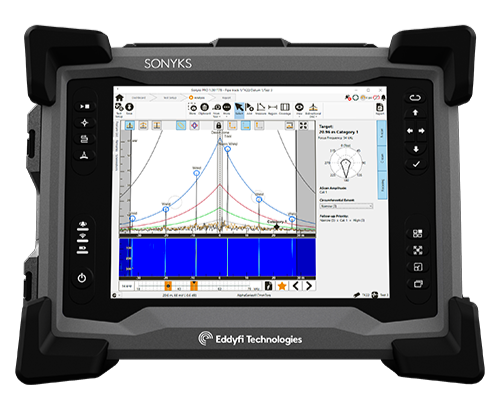
Half a year later, Eddyfi Technologies launched Sonyks and I had the opportunity to test out the most advanced guided wave ultrasonic testing instrument! The system is the successor of the Teletest Focus+ system and has been completely redesigned, packing unprecedented new features and capabilities.
The standard Piezo collar range still exists from 15 to 182 centimeters (6 to 72 inches) but the smaller 5 to 10 centimeter (2 to 4 inch) diameter tool, previously called Mini Test, has been replaced by Magnetostrictive tools. The Piezo tools have been completely redesigned. First, the ring spacing has changed to create a broadband frequency spectrum and improved power output. The wires to connect the individual modules are now mounted inside the collar, simplifying setting up the collar before inspection. The hinge to lock the collar in place has also been greatly improved, making it easy to mount the collar on any diameter pipe. The whole collar connects to the Sonyks data acquisition unit using a single multicore cable. The Magnetostrictive tools are available from 5 to 10 centimeters (2 to 4 inches). Because we no longer use Piezo transducers, the spatial resolution has dramatically improved for small diameter pipes. Combining this with having a 32, 64, and 128 kHz collar presents an unmatched opportunity for inspecting and identifying the often numerous small defects found in small diameter, short section pipework.
The data acquisition unit is newly housed in a battery-operated, light, and portable case similar to other Eddyfi instruments such as the Reddy®, Swift™, and Amigo™ 2. It includes a pump and a large touchscreen. The electronics have been completely redesigned with a much-improved signal-to-noise ratio (SNR) as a result.
The most significant change is in the Sonyks software and how inspection data is collected. When starting your inspection, data is gathered while you complete the settings. Before you know it, all the information is collected in minutes. Data is acquired through the full matrix capture (FMC) principle, meaning that all possible transmitter-receiver combinations are recorded for a broad spectrum of frequencies. When your scans are complete, the system can be dismantled and the data analysis process conducted in a more comfortable environment. All the data is there, including any focusing you may want to do! The big advantage is that the risk of missed defects, incomplete focus or frequency data is eliminated, avoiding the risk of an expensive re-inspection later. The software is also redesigned with ease of use at its core. Data annotation is much easier with a "circular menu" from where you can choose the annotation type you wish, including setting the distance amplitude curve (DAC) markers.
Anyway, before my enthusiasm has you running to our online store, let’s stick to the facts and have a look at the test performed.
The test was performed on a 10-centimeter (4-inch) by 2-meter (6.6-feet) length section with eight 1.5-millimeter (0.05-inch) diameter through-holes drilled in a spiral manner around the pipe. On the pipe section we used the 128KHz Magnetostrictive tools to demonstrate the high resolution obtained. The other benefit is that the dead zone around the collar is minimal with these high frequency collars, making small section, small diameter pipework very suitable for this type of inspection. Of course, the fact that we can detect 1.5 millimeters (0.05 inches) through-holes with GWT is nothing short of spectacular. During the test, I narrowed it down to an eight-step approach with excellent results.

STEP 1: The collar had to be placed to start inspection. The Magnetostrictive tools are installed differently than the Piezo tools and the pump was not needed in this case. The collar itself is very easily mounted with just one bolt to secure it. The cable connection is simple with two Lemo connectors that attach to the collar. When starting to fill out all the information on the screen about the project and the pipe at hand, the system was already collecting data. To my surprise, the system was finished collecting all the data before I finished completing the project information.

STEP 2: When the system was ready to collect all the data, the time of flight (TOF) data was presented on screen the way we are used to with GWT data envelopes. The system had already proposed annotations on the A-scan responses or echoes. These echoes come from known features. In our case, the echoes represent pipe ends as we were only dealing with a short section of pipe. As soon as some of the pipe features were annotated, this also allowed us to add the DAC curve to the data.

STEP 3: To add the DAC curve, I clicked on the pipe end annotation features to select that point on the TOF plot. The software presents a very easy-to-use and sophisticated "ring" that allows you to select several options. In this case, I chose the DAC option. As soon as I selected two welds, the software calculated the attenuation rate, and the DAC curve was automatically drawn.

STEP 4: I then selected the area from the TOF or A-scan plot to focus only on the area of interest. In normal conditions on longer pipe sections, this would be where the SNR becomes too low, but in this case, we focused on the pipe data just before the first reflection of the flange.

STEP 5: Once I eliminated the areas of lesser interest from my plot, I used the "auto gain" option to increase the relatively small signals on the plot"s linear scale. I immediately saw several echoes stand out from the noise, indicating there might be areas with defects. I still looked at my 128kHz plot but adjusted the frequency slider. The bottom of the screen shows that the 135kHz plot has even better resolution. I could identify the individual drilled holes in the pipe wall!

STEP 6: Now that I had found several defects in the pipe, it was time to classify them using the annotate ring to call them. Given the small size and the fact that they are well below the -24dB DAC line, we needed to call them CAT1 anomalies. Again, this was done in seconds and allowed me to classify the defect further using the focus plot. This calculates the origin of the reflected signal and helps determine whether a defect is deep and narrow or shallow and wide. The focus plot showed the result of a drilled hole being deep and narrow. A helpful tool in this case was the "gate adjust" option that allows you to look at a small section of the time spectrum and view the defects individually when moving the gate adjustment slider.

STEP 7: Once we had classified the defects and created focus data for the anomalies, we looked at the C-scan. The C-scan is a great tool to visualize the defects and get a feeling about the size of the defects. To get a result on the C-scan for my measurement I had to look at a region of -65dB to -72.5dB meaning that the defects were in the order of magnitude 0.1% to 0.2% of the normally 100% reflector, which is the pipe end. Talk about sensitivity.

STEP 8: Finally, when all the analysis steps were complete, I could focus on creating a report. The user-friendly report generator is embedded in the software. All the information previously entered is automatically added as well as all of my analysis steps and annotations. Also added are the focus plots, any screenshots taken, and comments entered in the software. Only minutes after completing my analysis, I could walk away with a comprehensive report that I would happily share with my customers!

The test performed is an excellent example of what I think is a new sweet spot for guided wave testing: short sections of small diameter pipe of which we find hundreds of kilometers at every plant around the world. For sure, this system works equally well on larger diameter pipes using the Piezo collars. Another great advantage is being able to use existing collars with Sonyks along with collars made by other vendors, allowing the user to minimize their upfront investment.
In conclusion, I can say I’m incredibly impressed with this new Sonyks guided wave testing solution by Eddyfi Technologies, and I feel very confident that others will also share my findings. If you would like to discuss the options of the new guided wave testing system with me, you can find me here or get in touch with our team who will be happy to help with your general inquires on how to stay Beyond Current.